2012 United States presidential election in Delaware
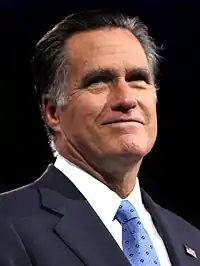
The 2012 United States presidential election in Delaware took place on November 6, 2012, as part of the 2012 United States presidential election in which all 50 states plus the District of Columbia participated. Delaware voters chose three electors to represent them in the Electoral College via a popular vote pitting incumbent Democratic President Barack Obama and his running mate, Vice President Joe Biden, against Republican challenger and former Massachusetts Governor Mitt Romney and his running mate, Congressman Paul Ryan.
| ||||||||||||||||||||||||||
| ||||||||||||||||||||||||||
 County Results
| ||||||||||||||||||||||||||
| ||||||||||||||||||||||||||
Democratic primary
The Democratic primary in Delaware was cancelled as President Obama was the only candidate to file for the ballot, and received Delaware's entire delegation.[1]
Republican primary
| |||||||||||||||||||||||||
| |||||||||||||||||||||||||
 Delaware results by county
Mitt Romney | |||||||||||||||||||||||||
| Elections in Delaware |
|---|
 |
2012 U.S. presidential election | |
|---|---|
| Democratic Party | |
| Republican Party | |
| Related races | |
| |
The 2012 Delaware Republican presidential primary took place on April 24, 2012.[2][3]
| Delaware Republican primary, 2012[4] | |||
|---|---|---|---|
| Candidate | Votes | Percentage | Delegates |
| Mitt Romney | 16,143 | 56.5% | 17 |
| Newt Gingrich | 7,742 | 27.1% | 0 |
| Ron Paul | 3,017 | 10.6% | 0 |
| Rick Santorum | 1,690 | 5.9% | 0 |
| Unprojected delegates: | 0 | ||
| Total: | 28,592 | 100% | 17 |
| Key: | Withdrew prior to contest |
General election
Candidate Ballot Access:
- Mitt Romney/Paul Ryan, Republican
- Barack Obama/Joseph Biden, Democratic
- Gary Johnson/James P. Gray, Libertarian
- Jill Stein/Cheri Honkala, Green
Write-In Candidate Access:
- Rocky Anderson/Luis J. Rodriguez, Justice
Results
| 2012 United States presidential election in Delaware[5] | ||||||
|---|---|---|---|---|---|---|
| Party | Candidate | Running mate | Votes | Percentage | Electoral votes | |
| Democratic | Barack Obama | Joe Biden | 242,584 | 58.61% | 3 | |
| Republican | Mitt Romney | Paul Ryan | 165,484 | 39.98% | 0 | |
| Libertarian | Gary Johnson | Jim Gray | 3,882 | 0.94% | 0 | |
| Green | Jill Stein | Cheri Honkala | 1,940 | 0.47% | 0 | |
| Totals | 413,890 | 100.00% | 3 | |||
| Voter turnout | 65.00% | |||||
By county
| County | Obama | Obama# | Romney | Romney# | Others | Others# |
|---|---|---|---|---|---|---|
| New Castle | 66.30% | 167,082 | 32.23% | 81,230 | 1.47% | 3,684 |
| Kent | 51.73% | 35,527 | 46.79% | 32,135 | 1.48% | 1,010 |
| Sussex | 42.88% | 39,975 | 55.91% | 52,119 | 1.21% | 1,128 |
See also
References
- "Delaware Democratic Delegation 2012". www.thegreenpapers.com. Retrieved 2020-10-30.
- "Primary and Caucus Printable Calendar". CNN. Retrieved January 11, 2012.
- "Presidential Primary Dates" (PDF). Federal Election Commission. Retrieved January 23, 2012.
- State of Delaware official election results
- "Official General Election Results". State of Delaware. 2012-11-07. Retrieved 2012-11-07.
External links
- The Green Papers: for Delaware
- The Green Papers: Major state elections in chronological order


.jpg.webp)
.jpg.webp)
