1996 United States presidential election in New Jersey
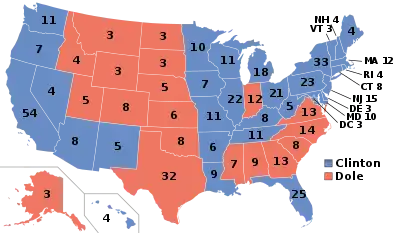
The 1996 United States presidential election in New Jersey took place on November 5, 1996, and was part of the 1996 United States presidential election. Voters chose 15 representatives, or electors to the Electoral College, who voted for president and vice president. The major contenders were incumbent Democratic President Bill Clinton and Republican Senator from Kansas Bob Dole, with Reform Party candidate Ross Perot – listed as an "Independent" in New Jersey – running a distant third.
| |||||||||||||||||||||||||||||||||
| |||||||||||||||||||||||||||||||||
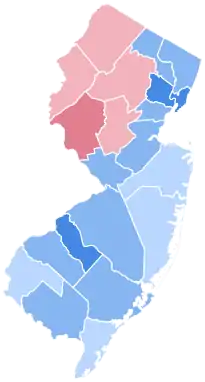
 County Results
| |||||||||||||||||||||||||||||||||
| |||||||||||||||||||||||||||||||||
| Elections in New Jersey |
|---|
 |
New Jersey voted decisively to re-elect Democrat Bill Clinton, giving him 53.72% of the vote over Republican Bob Dole's 35.86%, a margin of 17.86%.
This double-digit win was indicative of a major shift in New Jersey politics toward the Democratic Party. As recently as the 1980s, Republican presidential candidates had easily carried the state by double-digit margins. In 1992, Bill Clinton had won the state, but only with a narrow 43-41 plurality over George H.W. Bush. As in neighboring New York and many other states, Clinton in 1996 drastically improved his electoral performance among suburban voters, a key voting bloc in New Jersey. Following this election, New Jersey has become a reliable blue state in presidential elections, not being seriously contested by Republicans since. Despite this, Dole is currently the only Republican to fail to garner 40 percent of the New Jersey ballot since Barry Goldwater in 1964. Dole also remains the only Republican since Goldwater to fail to carry Cape May and Ocean Counties,[1] whilst Clinton in 1996 also became the first Democrat since Lyndon Johnson to win Monmouth, Bergen and Passaic Counties – the last pair having never voted for a Republican since.[1]
Results
| 1996 United States presidential election in New Jersey[2] | ||||||
|---|---|---|---|---|---|---|
| Party | Candidate | Votes | Percentage | Electoral votes | ||
| Democratic | Bill Clinton | 1,652,329 | 53.72% | 15 | ||
| Republican | Bob Dole | 1,103,078 | 35.86% | 0 | ||
| Independent | Ross Perot | 262,134 | 8.52% | 0 | ||
| Independent | Ralph Nader | 32,465 | 1.06% | 0 | ||
| Independent | Harry Browne | 14,763 | 0.48% | 0 | ||
| Independent | John Hagelin | 3,887 | 0.13% | 0 | ||
| Independent | Howard Phillips | 3,440 | 0.11% | 0 | ||
| Independent | James Harris | 1,837 | 0.06% | 0 | ||
| Independent | Monica Moorehead | 1,337 | 0.04% | 0 | ||
| Independent | Jerome White | 537 | 0.02% | 0 | ||
| Totals | 3,075,807 | 100.00% | 15 | |||
| Voter Turnout (Voting age/Registered) | 51%/71% | |||||
Results by county
| County | William Jefferson Clinton Democratic |
Robert Joseph Dole Republican |
Henry Ross Perot Independent |
Various candidates Other parties |
Margin | Total votes cast | |||||
|---|---|---|---|---|---|---|---|---|---|---|---|
| # | % | # | % | # | % | # | % | # | % | ||
| Atlantic | 44,434 | 53.15% | 29,538 | 35.33% | 8,261 | 9.88% | 1,368 | 1.64% | 14,896 | 17.82% | 83,601 |
| Bergen | 191,085 | 52.66% | 141,164 | 38.90% | 25,512 | 7.03% | 5,126 | 1.41% | 49,921 | 13.76% | 362,887 |
| Burlington | 85,086 | 51.94% | 57,337 | 35.00% | 18,407 | 11.24% | 2,979 | 1.82% | 27,749 | 16.94% | 163,809 |
| Camden | 114,962 | 60.59% | 52,791 | 27.83% | 17,433 | 9.19% | 4,537 | 2.39% | 62,171 | 32.77% | 189,723 |
| Cape May | 19,849 | 44.07% | 19,357 | 42.98% | 4,978 | 11.05% | 852 | 1.89% | 492 | 1.09% | 45,036 |
| Cumberland | 25,444 | 54.68% | 14,744 | 31.69% | 5,348 | 11.49% | 997 | 2.14% | 10,700 | 22.99% | 46,533 |
| Essex | 175,368 | 68.99% | 65,162 | 25.63% | 9,513 | 3.74% | 4,153 | 1.63% | 110,206 | 43.35% | 254,196 |
| Gloucester | 51,915 | 51.66% | 32,116 | 31.96% | 14,361 | 14.29% | 2,103 | 2.09% | 19,799 | 19.70% | 100,495 |
| Hudson | 116,121 | 69.95% | 38,288 | 23.06% | 8,965 | 5.40% | 2,635 | 1.59% | 77,833 | 46.88% | 166,009 |
| Hunterdon | 18,446 | 35.66% | 26,379 | 51.00% | 5,686 | 10.99% | 1,216 | 2.35% | -7,933 | -15.34% | 51,727 |
| Mercer | 77,641 | 58.94% | 40,559 | 30.79% | 10,536 | 8.00% | 2,990 | 2.27% | 37,082 | 28.15% | 131,726 |
| Middlesex | 145,201 | 56.20% | 82,433 | 31.90% | 24,643 | 9.54% | 6,109 | 2.36% | 62,768 | 24.29% | 258,386 |
| Monmouth | 120,414 | 48.37% | 99,975 | 40.16% | 22,754 | 9.14% | 5,818 | 2.34% | 20,439 | 8.21% | 248,961 |
| Morris | 81,092 | 41.43% | 95,830 | 48.96% | 15,299 | 7.82% | 3,524 | 1.80% | -14,738 | -7.53% | 195,745 |
| Ocean | 94,243 | 46.43% | 82,830 | 40.81% | 22,864 | 11.26% | 3,039 | 1.50% | 11,413 | 5.62% | 202,976 |
| Passaic | 85,879 | 56.15% | 53,594 | 35.04% | 10,944 | 7.16% | 2,534 | 1.66% | 32,285 | 21.11% | 152,951 |
| Salem | 12,044 | 46.34% | 9,294 | 35.76% | 4,124 | 15.87% | 530 | 2.04% | 2,750 | 10.58% | 25,992 |
| Somerset | 50,673 | 44.87% | 51,869 | 45.93% | 8,377 | 7.42% | 2,010 | 1.78% | -1,196 | -1.06% | 112,929 |
| Sussex | 19,525 | 36.04% | 26,746 | 49.36% | 6,705 | 12.37% | 1,207 | 2.23% | -7,221 | -13.33% | 54,183 |
| Union | 108,102 | 56.82% | 65,912 | 34.65% | 12,432 | 6.53% | 3,795 | 1.99% | 42,190 | 22.18% | 190,241 |
| Warren | 14,805 | 39.27% | 17,160 | 45.52% | 4,992 | 13.24% | 744 | 1.97% | -2,355 | -6.25% | 37,701 |
| Totals | 1,652,329 | 53.72% | 1,103,078 | 35.86% | 262,134 | 8.52% | 58,266 | 1.89% | 549,251 | 17.86% | 3,075,807 |
References
- Sullivan, Robert David; ‘How the Red and Blue Map Evolved Over the Past Century’; America Magazine in The National Catholic Review; June 29, 2016
- "1996 Presidential General Election Results - New Jersey". U.S. Election Atlas. Retrieved 5 February 2013.


