1972 United States presidential election in New Hampshire
The 1972 United States presidential election in New Hampshire took place on November 7, 1972, as part of the 1972 United States presidential election, which was held throughout all 50 states and D.C. Voters chose four representatives, or electors to the Electoral College, who voted for president and vice president.
| ||||||||||||||||||||||||||
| ||||||||||||||||||||||||||
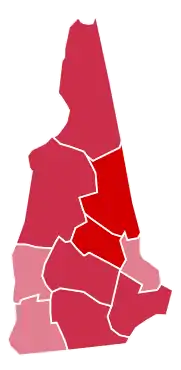
 County Results
Nixon 50-60% 60-70% 70-80%
| ||||||||||||||||||||||||||
| ||||||||||||||||||||||||||
| Elections in New Hampshire |
|---|
 |
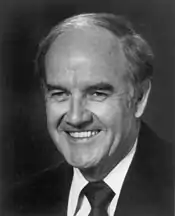
New Hampshire was won by the Republican nominees, incumbent President Richard Nixon of California and his running mate incumbent Vice President Spiro Agnew of Maryland. Nixon and Agnew defeated the Democratic nominees, Senator George McGovern of South Dakota and his running mate United States Ambassador Sargent Shriver of Maryland.
Nixon took 63.98% of the vote to McGovern's 34.85%, a margin of 29.12%.
New Hampshire in this era normally leaned Republican, having not gone Democratic since the nationwide Democratic landslide of 1964.
As Nixon won re-election nationally in a 49-state landslide, New Hampshire easily remained in the Republican column, with McGovern's only victories coming from neighboring Massachusetts and the District of Columbia.
On the county map, Nixon swept all 10 of the state's counties, breaking 60% in 7 of them. As in previous elections, Carroll County and Belknap County were the most Republican counties in the state, both voting over 70% for Nixon. McGovern's strongest county was Strafford County, where he managed 41.3% of the vote to Nixon's 57.8%.
Amidst Nixon's landslide nationwide win, New Hampshire would weigh in as almost 6% more Republican than the national average, and would be the most Republican state in the Northeast.
Nixon had previously won New Hampshire in both 1960 and 1968.
Results
| 1972 United States presidential election in New Hampshire[1] | |||||
|---|---|---|---|---|---|
| Party | Candidate | Votes | Percentage | Electoral votes | |
| Republican | Richard Nixon | 213,724 | 63.98% | 4 | |
| Democratic | George McGovern | 116,435 | 34.85% | 0 | |
| American Independent | John G. Schmitz | 3,386 | 1.01% | 0 | |
| Socialist Workers | Linda Jenness | 368 | 0.11% | 0 | |
| Write-ins | Write-ins | 146 | 0.04% | 0 | |
| Totals | 334,059 | 100.00% | 4 | ||
| Voter Turnout (Voting age/Registered) | 64%/74% | ||||
Results by county
| County | Richard Milhous Nixon Republican |
George Stanley McGovern Democratic |
John George Schmitz[2] American Independent |
Various candidates[2] Other parties |
Margin | Total votes cast | |||||
|---|---|---|---|---|---|---|---|---|---|---|---|
| # | % | # | % | # | % | # | % | # | % | ||
| Belknap | 11,536 | 70.72% | 4,610 | 28.26% | 143 | 0.88% | 23 | 0.14% | 6,926 | 42.46% | 16,312 |
| Carroll | 8,525 | 77.01% | 2,395 | 21.64% | 128 | 1.16% | 22 | 0.20% | 6,130 | 55.37% | 11,070 |
| Cheshire | 13,390 | 58.98% | 9,157 | 40.33% | 132 | 0.58% | 24 | 0.11% | 4,233 | 18.65% | 22,703 |
| Coös | 9,468 | 60.84% | 5,829 | 37.45% | 204 | 1.31% | 62 | 0.40% | 3,639 | 23.38% | 15,563 |
| Grafton | 16,605 | 65.58% | 8,388 | 33.13% | 288 | 1.14% | 38 | 0.15% | 8,217 | 32.45% | 25,319 |
| Hillsborough | 65,274 | 64.39% | 34,739 | 34.27% | 1,258 | 1.24% | 106 | 0.10% | 30,535 | 30.12% | 101,377 |
| Merrimack | 25,354 | 67.70% | 11,737 | 31.34% | 308 | 0.82% | 50 | 0.13% | 13,617 | 36.36% | 37,453 |
| Rockingham | 38,825 | 63.09% | 21,998 | 35.75% | 615 | 1.00% | 103 | 0.17% | 16,827 | 27.34% | 61,541 |
| Strafford | 16,846 | 57.83% | 12,028 | 41.29% | 188 | 0.65% | 67 | 0.23% | 4,818 | 16.54% | 29,129 |
| Sullivan | 7,901 | 58.13% | 5,554 | 40.86% | 122 | 0.90% | 15 | 0.11% | 2,347 | 17.27% | 13,592 |
| Totals | 213,724 | 63.98% | 116,435 | 34.85% | 3,386 | 1.01% | 510 | 0.15% | 97,289 | 29.12% | 334,059 |
See also
References
- "1972 Presidential General Election Results – New Hampshire". Dave Leip's Atlas of U.S. Presidential Elections. Retrieved 2013-11-16.
- Our Campaigns; NH US President Race, November 07, 1972


