1988 United States presidential election in Maine
The 1988 United States presidential election in Maine took place on November 8, 1988, as part of the 1988 United States presidential election, which was held throughout all 50 states and D.C.. Voters chose four representatives, or electors to the Electoral College, who voted for president and vice president.
| ||||||||||||||||||||||||||
| ||||||||||||||||||||||||||
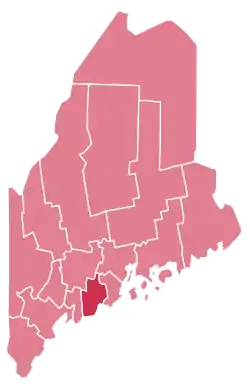
 County Results
Bush 50–60% 60–70%
| ||||||||||||||||||||||||||
| ||||||||||||||||||||||||||
| Elections in Maine |
|---|
 |
Maine voted for the Republican nominee, Vice President George H. W. Bush, over the Democratic nominee, Massachusetts Governor Michael Dukakis, by a margin of 11.45%. Bush took 55.34% of the vote to Dukakis’ 43.88%.
Bush's comfortable win was expected, as the state was at the time Republican-leaning, and the Bush family also had ties to Maine, with Bush owning a house in Kennebunkport, Maine.
Like the rest of liberal and secular New England, however, Maine would soon begin to drift to the Democratic Party as the Republican Party became increasingly dominated by conservatives, Southerners, and Evangelical Christians. Consequently, this would be the last time that a Republican would carry the state of Maine in a presidential election as a whole, and in the following two decades it would become regarded as a safe blue state. Maine's Second Congressional District, however, gave its electoral vote to Republican candidate Donald Trump in 2016 and 2020.
As of the 2020 presidential election, this is the last election in which a Republican presidential candidate was able to win every county in the state as well as the last time the counties of Cumberland, Hancock, Knox, Sagadahoc and York voted for a Republican presidential candidate.[1] Despite winning every county in the state this election, Bush would not win a single one during his re-election bid in 1992.
Results
| 1988 United States presidential election in Maine[2] | |||||
|---|---|---|---|---|---|
| Party | Candidate | Votes | Percentage | Electoral votes | |
| Republican | George H. W. Bush | 307,131 | 55.34% | 4 | |
| Democratic | Michael Dukakis | 243,569 | 43.88% | 0 | |
| Libertarian | Ron Paul | 2,700 | 0.49% | 0 | |
| New Alliance | Lenora Fulani | 1,405 | 0.25% | 0 | |
| No party | Write-ins | 230 | 0.04% | 0 | |
| Totals | 555,035 | 100.00% | 4 | ||
| Voter Turnout (Voting age/Registered) | 62%/65% | ||||
Results by county
| County | George Herbert Walker Bush[3] Republican |
Michael Stanley Dukakis[3] Democratic |
Ronald Ernest Paul[3] Libertarian |
Various candidates[3] Other parties |
Margin | Total votes cast | |||||
|---|---|---|---|---|---|---|---|---|---|---|---|
| # | % | # | % | # | % | # | % | # | % | ||
| Androscoggin | 23,061 | 51.72% | 21,165 | 47.47% | 203 | 0.46% | 156 | 0.35% | 1,896 | 4.25% | 44,585 |
| Aroostook | 17,213 | 53.38% | 14,850 | 46.05% | 101 | 0.31% | 82 | 0.25% | 2,363 | 7.33% | 32,246 |
| Cumberland | 63,028 | 52.93% | 55,220 | 46.37% | 566 | 0.48% | 261 | 0.22% | 7,808 | 6.56% | 119,075 |
| Franklin | 7,180 | 54.16% | 5,960 | 44.96% | 70 | 0.53% | 46 | 0.35% | 1,220 | 9.20% | 13,256 |
| Hancock | 12,957 | 56.07% | 9,929 | 42.97% | 146 | 0.63% | 75 | 0.32% | 3,028 | 13.10% | 23,107 |
| Kennebec | 27,734 | 53.60% | 23,578 | 45.57% | 220 | 0.43% | 213 | 0.41% | 4,156 | 8.03% | 51,745 |
| Knox | 10,156 | 57.54% | 7,343 | 41.60% | 100 | 0.57% | 51 | 0.29% | 2,813 | 15.94% | 17,650 |
| Lincoln | 9,837 | 61.79% | 5,939 | 37.31% | 99 | 0.62% | 45 | 0.28% | 3,898 | 24.48% | 15,920 |
| Oxford | 13,568 | 55.91% | 10,523 | 43.37% | 108 | 0.45% | 67 | 0.28% | 3,045 | 12.55% | 24,266 |
| Penobscot | 34,912 | 54.76% | 28,429 | 44.59% | 241 | 0.38% | 172 | 0.27% | 6,483 | 10.17% | 63,754 |
| Piscataquis | 4,788 | 58.27% | 3,323 | 40.44% | 70 | 0.85% | 36 | 0.44% | 1,465 | 17.83% | 8,217 |
| Sagadahoc | 8,825 | 58.22% | 6,212 | 40.98% | 70 | 0.46% | 51 | 0.34% | 2,613 | 17.24% | 15,158 |
| Somerset | 11,430 | 56.58% | 8,603 | 42.59% | 98 | 0.49% | 70 | 0.35% | 2,827 | 13.99% | 20,201 |
| Waldo | 8,236 | 55.73% | 6,402 | 43.32% | 80 | 0.54% | 60 | 0.41% | 1,834 | 12.41% | 14,778 |
| Washington | 7,872 | 56.93% | 5,831 | 42.17% | 69 | 0.50% | 56 | 0.40% | 2,041 | 14.76% | 13,828 |
| York | 46,334 | 59.98% | 30,262 | 39.17% | 459 | 0.59% | 194 | 0.25% | 16,072 | 20.81% | 77,249 |
| Totals | 307,131 | 55.34% | 243,569 | 43.88% | 2,700 | 0.49% | 1,635 | 0.29% | 63,562 | 11.45% | 555,035 |
References
- Sullivan, Robert David; ‘How the Red and Blue Map Evolved Over the Past Century’; America Magazine in The National Catholic Review; June 29, 2016
- "1988 Presidential General Election Results – Maine". Dave Leip’s Atlas of U.S. Presidential Elections. Retrieved 2013-02-07.
- Our Campaigns; ME US President Race, November 08, 1988
.jpg.webp)

