1968 United States presidential election in Montana
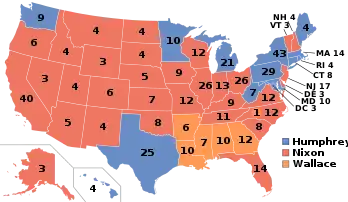
The 1968 United States presidential election in Montana took place on November 5, 1968, and was part of the 1968 United States presidential election. Voters chose four representatives, or electors to the Electoral College, who voted for president and vice president.
| |||||||||||||||||||||||||||||||||
| |||||||||||||||||||||||||||||||||
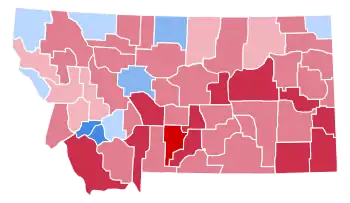
 County Results
| |||||||||||||||||||||||||||||||||
| |||||||||||||||||||||||||||||||||
| Elections in Montana |
|---|
 |
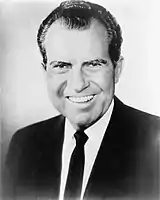
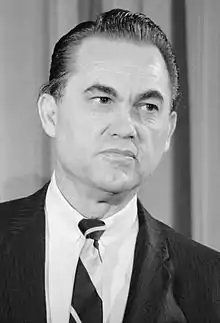
Montana voted for the Republican nominee, former Vice President Richard Nixon, over the Democratic nominee, Vice President Hubert Humphrey. Nixon won Montana by a large margin of 9.01%. A third-party candidate, former Alabama Governor George Wallace, won 7.29% of the vote, or 20,015 raw votes, the highest percentage for a 3rd party candidate in the state since Robert M. La Follette in 1924, and would not be surpassed or equaled until Independent John B. Anderson in 1980, who went on to receive 8.05% of the vote, or 29,281 raw votes. Wallace was most successful in the mountain regions, which have a tradition of hostility to Washington D.C. interference, and also to Northeastern big business.[1] Wallace possessed little appeal in heavily German and Scandinavian Plains regions.
As of the 2020 presidential election, this remains the last occasion the Democratic presidential nominee has carried Jefferson County,[2] where Humphrey won a 22-vote plurality.
Results
| 1968 United States presidential election in Montana[3] | |||||
|---|---|---|---|---|---|
| Party | Candidate | Votes | Percentage | Electoral votes | |
| Republican | Richard Nixon | 138,835 | 50.60% | 4 | |
| Democratic | Hubert Humphrey | 114,117 | 41.59% | 0 | |
| American | George Wallace | 20,015 | 7.29% | 0 | |
| Prohibition | E. Harold Munn | 510 | 0.19% | 0 | |
| New Reform | No Candidate | 470 | 0.17% | 0 | |
| Militant Workers | Fred Halstead | 457 | 0.17% | 0 | |
| Totals | 274,404 | 100.00% | 4 | ||
Results by county
| County | Richard Milhous Nixon Republican |
Hubert Horatio Humphrey Democratic |
George Corley Wallace American |
Various candidates Other parties |
Margin | Total votes cast | |||||
|---|---|---|---|---|---|---|---|---|---|---|---|
| # | % | # | % | # | % | # | % | # | % | ||
| Beaverhead | 1,896 | 61.04% | 853 | 27.46% | 357 | 11.49% | 0 | 0.00% | 1,043 | 33.58% | 3,106 |
| Big Horn | 1,789 | 53.87% | 1,319 | 39.72% | 209 | 6.29% | 4 | 0.12% | 470 | 14.15% | 3,321 |
| Blaine | 1,291 | 48.63% | 1,198 | 45.12% | 165 | 6.21% | 1 | 0.04% | 93 | 3.50% | 2,655 |
| Broadwater | 671 | 54.29% | 439 | 35.52% | 125 | 10.11% | 1 | 0.08% | 232 | 18.77% | 1,236 |
| Carbon | 1,972 | 54.98% | 1,353 | 37.72% | 258 | 7.19% | 4 | 0.11% | 619 | 17.26% | 3,587 |
| Carter | 624 | 62.21% | 269 | 26.82% | 110 | 10.97% | 0 | 0.00% | 355 | 35.39% | 1,003 |
| Cascade | 11,588 | 43.23% | 13,507 | 50.39% | 1,539 | 5.74% | 169 | 0.63% | -1,919 | -7.16% | 26,803 |
| Chouteau | 1,695 | 53.66% | 1,216 | 38.49% | 247 | 7.82% | 1 | 0.03% | 479 | 15.16% | 3,159 |
| Custer | 2,831 | 58.06% | 1,760 | 36.10% | 275 | 5.64% | 10 | 0.21% | 1,071 | 21.96% | 4,876 |
| Daniels | 826 | 52.15% | 688 | 43.43% | 69 | 4.36% | 1 | 0.06% | 138 | 8.71% | 1,584 |
| Dawson | 2,650 | 58.01% | 1,695 | 37.11% | 220 | 4.82% | 3 | 0.07% | 955 | 20.91% | 4,568 |
| Deer Lodge | 1,554 | 25.58% | 4,208 | 69.28% | 308 | 5.07% | 4 | 0.07% | -2,654 | -43.69% | 6,074 |
| Fallon | 990 | 63.26% | 477 | 30.48% | 97 | 6.20% | 1 | 0.06% | 513 | 32.78% | 1,565 |
| Fergus | 3,367 | 55.59% | 2,070 | 34.18% | 616 | 10.17% | 4 | 0.07% | 1,297 | 21.41% | 6,057 |
| Flathead | 7,215 | 51.54% | 5,253 | 37.52% | 1,524 | 10.89% | 8 | 0.06% | 1,962 | 14.01% | 14,000 |
| Gallatin | 7,433 | 62.06% | 3,818 | 31.88% | 706 | 5.89% | 21 | 0.18% | 3,615 | 30.18% | 11,978 |
| Garfield | 542 | 64.22% | 190 | 22.51% | 112 | 13.27% | 0 | 0.00% | 352 | 41.71% | 844 |
| Glacier | 1,643 | 44.76% | 1,723 | 46.94% | 295 | 8.04% | 10 | 0.27% | -80 | -2.18% | 3,671 |
| Golden Valley | 332 | 60.04% | 194 | 35.08% | 26 | 4.70% | 1 | 0.18% | 138 | 24.95% | 553 |
| Granite | 626 | 49.56% | 502 | 39.75% | 135 | 10.69% | 0 | 0.00% | 124 | 9.82% | 1,263 |
| Hill | 2,970 | 44.53% | 3,386 | 50.77% | 305 | 4.57% | 8 | 0.12% | -416 | -6.24% | 6,669 |
| Jefferson | 798 | 45.06% | 820 | 46.30% | 152 | 8.58% | 1 | 0.06% | -22 | -1.24% | 1,771 |
| Judith Basin | 804 | 53.03% | 606 | 39.97% | 106 | 6.99% | 0 | 0.00% | 198 | 13.06% | 1,516 |
| Lake | 3,358 | 55.98% | 1,956 | 32.61% | 679 | 11.32% | 6 | 0.10% | 1,402 | 23.37% | 5,999 |
| Lewis and Clark | 7,979 | 56.53% | 5,379 | 38.11% | 723 | 5.12% | 34 | 0.24% | 2,600 | 18.42% | 14,115 |
| Liberty | 670 | 58.57% | 390 | 34.09% | 83 | 7.26% | 1 | 0.09% | 280 | 24.48% | 1,144 |
| Lincoln | 2,355 | 40.55% | 2,677 | 46.10% | 765 | 13.17% | 10 | 0.17% | -322 | -5.55% | 5,807 |
| McCone | 733 | 52.17% | 589 | 41.92% | 82 | 5.84% | 1 | 0.07% | 144 | 10.25% | 1,405 |
| Madison | 1,289 | 56.39% | 734 | 32.11% | 261 | 11.42% | 2 | 0.09% | 555 | 24.28% | 2,286 |
| Meagher | 543 | 62.92% | 218 | 25.26% | 102 | 11.82% | 0 | 0.00% | 325 | 37.66% | 863 |
| Mineral | 483 | 41.32% | 576 | 49.27% | 108 | 9.24% | 2 | 0.17% | -93 | -7.96% | 1,169 |
| Missoula | 9,745 | 48.02% | 8,398 | 41.39% | 1,638 | 8.07% | 511 | 2.52% | 1,347 | 6.64% | 20,292 |
| Musselshell | 953 | 51.15% | 795 | 42.67% | 111 | 5.96% | 4 | 0.21% | 158 | 8.48% | 1,863 |
| Park | 3,063 | 57.36% | 1,815 | 33.99% | 460 | 8.61% | 2 | 0.04% | 1,248 | 23.37% | 5,340 |
| Petroleum | 211 | 62.99% | 98 | 29.25% | 26 | 7.76% | 0 | 0.00% | 113 | 33.73% | 335 |
| Phillips | 1,353 | 51.41% | 1,100 | 41.79% | 177 | 6.72% | 2 | 0.08% | 253 | 9.61% | 2,632 |
| Pondera | 1,530 | 52.98% | 1,149 | 39.79% | 205 | 7.10% | 4 | 0.14% | 381 | 13.19% | 2,888 |
| Powder River | 699 | 64.96% | 258 | 23.98% | 118 | 10.97% | 1 | 0.09% | 441 | 40.99% | 1,076 |
| Powell | 1,301 | 47.50% | 1,206 | 44.03% | 231 | 8.43% | 1 | 0.04% | 95 | 3.47% | 2,739 |
| Prairie | 635 | 67.77% | 270 | 28.82% | 30 | 3.20% | 2 | 0.21% | 365 | 38.95% | 937 |
| Ravalli | 3,183 | 53.25% | 2,080 | 34.80% | 709 | 11.86% | 5 | 0.08% | 1,103 | 18.45% | 5,977 |
| Richland | 2,381 | 59.29% | 1,399 | 34.84% | 228 | 5.68% | 8 | 0.20% | 982 | 24.45% | 4,016 |
| Roosevelt | 1,947 | 50.12% | 1,771 | 45.59% | 162 | 4.17% | 5 | 0.13% | 176 | 4.53% | 3,885 |
| Rosebud | 1,190 | 56.42% | 711 | 33.71% | 204 | 9.67% | 4 | 0.19% | 479 | 22.71% | 2,109 |
| Sanders | 1,459 | 48.70% | 1,242 | 41.46% | 292 | 9.75% | 3 | 0.10% | 217 | 7.24% | 2,996 |
| Sheridan | 1,180 | 45.81% | 1,275 | 49.50% | 115 | 4.46% | 6 | 0.23% | -95 | -3.69% | 2,576 |
| Silver Bow | 5,488 | 27.98% | 12,626 | 64.36% | 1,120 | 5.71% | 383 | 1.95% | -7,138 | -36.39% | 19,617 |
| Stillwater | 1,347 | 61.20% | 676 | 30.71% | 177 | 8.04% | 1 | 0.05% | 671 | 30.49% | 2,201 |
| Sweet Grass | 1,043 | 70.00% | 336 | 22.55% | 110 | 7.38% | 1 | 0.07% | 707 | 47.45% | 1,490 |
| Teton | 1,697 | 54.58% | 1,228 | 39.50% | 179 | 5.76% | 5 | 0.16% | 469 | 15.09% | 3,109 |
| Toole | 1,407 | 51.96% | 1,048 | 38.70% | 249 | 9.19% | 4 | 0.15% | 359 | 13.26% | 2,708 |
| Treasure | 298 | 56.55% | 188 | 35.67% | 41 | 7.78% | 0 | 0.00% | 110 | 20.87% | 527 |
| Valley | 2,290 | 49.44% | 1,926 | 41.58% | 393 | 8.48% | 23 | 0.50% | 364 | 7.86% | 4,632 |
| Wheatland | 673 | 51.77% | 525 | 40.38% | 101 | 7.77% | 1 | 0.08% | 148 | 11.38% | 1,300 |
| Wibaux | 347 | 52.98% | 252 | 38.47% | 56 | 8.55% | 0 | 0.00% | 95 | 14.50% | 655 |
| Yellowstone | 19,898 | 58.77% | 11,682 | 34.50% | 2,124 | 6.27% | 153 | 0.45% | 8,216 | 24.27% | 33,857 |
| Totals | 138,835 | 50.60% | 114,117 | 41.59% | 20,015 | 7.29% | 1,437 | 0.52% | 24,718 | 9.01% | 274,404 |
Notes
- Although he was born in California and he served as a U.S. Senator from California, in 1968 Richard Nixon's official state of residence was New York, because he moved there to practice law after his defeat in the 1962 California gubernatorial election. During his first term as president, Nixon re-established his residency in California. Consequently, most reliable reference books list Nixon’s home state as New York in the 1968 election and his home state as California in the 1972 (and 1960) election.
References
- Phillips, Kevin P.; The Emerging Republican Majority, p. 471 ISBN 978-0-691-16324-6
- Sullivan, Robert David; ‘How the Red and Blue Map Evolved Over the Past Century’; America Magazine in The National Catholic Review; June 29, 2016
- Dave Leip’s U.S. Election Atlas; 1968 Presidential General Election Results – Montana


