1898 United States House of Representatives elections in California
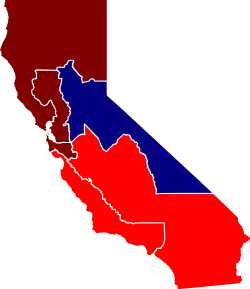
The United States House of Representatives elections in California, 1898 was an election for California's delegation to the United States House of Representatives, which occurred as part of the general election of the House of Representatives on November 8, 1898. Republicans took an open Democratic seat and defeated the two Populist incumbents.
| |||||||||||||||||||||||||||||
All 7 California seats to the United States House of Representatives | |||||||||||||||||||||||||||||
|---|---|---|---|---|---|---|---|---|---|---|---|---|---|---|---|---|---|---|---|---|---|---|---|---|---|---|---|---|---|
| |||||||||||||||||||||||||||||
 Election results by district. | |||||||||||||||||||||||||||||
| Elections in California |
|---|
 |
Overview
| United States House of Representatives elections in California, 1898 | |||||
|---|---|---|---|---|---|
| Party | Votes | Percentage | Seats | +/– | |
| Republican | 139,382 | 51.0% | 6 | +3 | |
| Democratic | 86,927 | 31.8% | 1 | -1 | |
| Populist | 41,179 | 15.1% | 0 | -2 | |
| Socialist Labor | 4,979 | 1.8% | 0 | 0 | |
| Independent | 594 | 0.2% | 0 | 0 | |
| Totals | 273,061 | 100.0% | 7 | — | |
Delegation Composition
| Pre-election | Seats | |
| Republican-Held | 3 | |
| Democratic-Held | 2 | |
| Populist-Held | 2 | |
| Post-election | Seats | |
| Republican-Held | 6 | |
| Democratic-Held | 1 | |
Results
District 1
| Party | Candidate | Votes | % | |
|---|---|---|---|---|
| Republican | John All Barham (incumbent) | 19,598 | 51.8 | |
| Democratic | Emmet Seawell | 18,244 | 48.2 | |
| Total votes | 37,842 | 100.0 | ||
| Turnout | ||||
| Republican hold | ||||
District 2
| Party | Candidate | Votes | % | |
|---|---|---|---|---|
| Democratic | Marion De Vries (incumbent) | 25,196 | 55.3 | |
| Republican | Frank D. Ryan | 20,400 | 44.7 | |
| Total votes | 45,596 | 100.0 | ||
| Turnout | ||||
| Democratic hold | ||||
District 3
| Party | Candidate | Votes | % | |
|---|---|---|---|---|
| Republican | Victor H. Metcalf | 20,592 | 57.3 | |
| Democratic | John A. Jones | 14,051 | 39.1 | |
| Socialist Labor | Thomas F. Burns | 1,309 | 3.6 | |
| Total votes | 35,952 | 100.0 | ||
| Turnout | ||||
| Republican hold | ||||
District 4
| Party | Candidate | Votes | % | |||
|---|---|---|---|---|---|---|
| Republican | Julius Kahn | 13,695 | 50.0 | |||
| Democratic | James H. Barry | 12,084 | 44.1 | |||
| Socialist Labor | W. J. Martin | 1,006 | 3.7 | |||
| Independent | Joseph P. Kelly | 594 | 2.2 | |||
| Total votes | 27,379 | 100.0 | ||||
| Turnout | ||||||
| Republican gain from Democratic | ||||||
District 5
| Party | Candidate | Votes | % | |
|---|---|---|---|---|
| Republican | Eugene F. Loud (incumbent) | 20,254 | 51.8 | |
| Democratic | William Craig | 17,352 | 44.3 | |
| Socialist Labor | E. T. Kingsley | 1,532 | 3.9 | |
| Total votes | 39,138 | 100.0 | ||
| Turnout | ||||
| Republican hold | ||||
District 6
| Party | Candidate | Votes | % | |||
|---|---|---|---|---|---|---|
| Republican | Russell J. Waters | 24,050 | 52.6 | |||
| Populist | Charles A. Barlow (incumbent) | 20,499 | 44.9 | |||
| Socialist Labor | James T. Van Ransselaer | 1,132 | 2.5 | |||
| Total votes | 45,681 | 100.0 | ||||
| Turnout | ||||||
| Republican gain from Populist | ||||||
District 7
| Party | Candidate | Votes | % | |||
|---|---|---|---|---|---|---|
| Republican | James C. Needham | 20,793 | 50.1 | |||
| Populist | Curtis H. Castle (incumbent) | 20,680 | 49.9 | |||
| Total votes | 41,473 | 100.0 | ||||
| Turnout | ||||||
| Republican gain from Populist | ||||||
See also
External links
This article is issued from Wikipedia. The text is licensed under Creative Commons - Attribution - Sharealike. Additional terms may apply for the media files.