Texas's 5th congressional district
Texas's 5th congressional district of the United States House of Representatives is in an area that includes a northeast portion of the City of Dallas, Dallas County including Mesquite plus a number of smaller suburban, exurban and rural counties south and east of Dallas, including Anderson, Cherokee, Henderson, Van Zandt, and Kaufman. As of the 2000 census, the 5th district represents 651,620 people. The current Representative from the 5th district is Lance Gooden, who won re-election in 2020 by defeating Democratic candidate Carolyn Salter.[4]
| Texas's 5th congressional district | |||
|---|---|---|---|
.tif.png.webp) Texas's 5th congressional district - since January 3, 2013. | |||
| Representative |
| ||
| Area | 5,043.85 sq mi (13,063.5 km2) | ||
| Distribution |
| ||
| Population (2019) | 759,749[2] | ||
| Median household income | $57,026 | ||
| Ethnicity |
| ||
| Cook PVI | R+16[3] | ||
2012 redistricting
After the 2012 redistricting process, the eastern half of Wood County was removed, and there were slight changes to the district in Dallas County.[5]
Voting
| Election results from presidential races | ||
|---|---|---|
| Year | Office | Results |
| 2000 | President | Bush 66 - 34% |
| 2004 | President | Bush 67 - 33% |
| 2008 | President | McCain 63 - 36% |
| 2012 | President | Romney 65 - 34% |
| 2016 | President | Trump 63 - 34% |
| 2020 | President | Trump 61 - 38% |
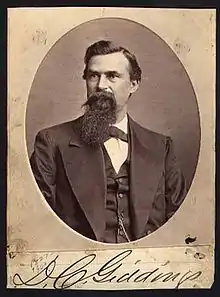
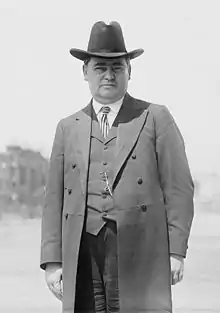
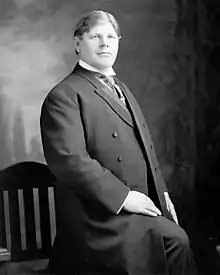
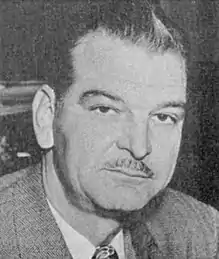
List of representatives
U.S. congressional district borders are periodically redrawn, therefore some district residence locations may no longer be in the 5th district.
.jpg.webp)
.jpg.webp)

.jpg.webp)

.jpg.webp)


Recent elections
2004
| Party | Candidate | Votes | % | |
|---|---|---|---|---|
| Republican | Jeb Hensarling | 148,816 | 64.5 | |
| Democratic | Bill Bernstein | 75,911 | 32.9 | |
| Libertarian | John Gonzalez | 6,118 | 2.7 | |
| Total votes | 230,845 | |||
| Republican hold | ||||
2006
| Party | Candidate | Votes | % | |
|---|---|---|---|---|
| Republican | Jeb Hensarling | 88,478 | 61.76 | |
| Democratic | Charlie Thompson | 50,983 | 35.58 | |
| Libertarian | Mike Nelson | 3,791 | 2.64 | |
| Total votes | 143,252 | |||
| Republican hold | ||||
2008
| Party | Candidate | Votes | % | |
|---|---|---|---|---|
| Republican | Jeb Hensarling | 162,894 | 83.59 | |
| Libertarian | Ken Ashby | 31,967 | 16.40 | |
| Total votes | 194,861 | |||
| Republican hold | ||||
2010
| Party | Candidate | Votes | % | |
|---|---|---|---|---|
| Republican | Jeb Hensarling | 106,742 | 70.52 | |
| Democratic | Tom Berry | 41,649 | 27.51 | |
| Libertarian | Ken Ashby | 2,958 | 1.95 | |
| Total votes | 151,349 | |||
| Republican hold | ||||
2012
| Party | Candidate | Votes | % | |
|---|---|---|---|---|
| Republican | Jeb Hensarling | 134,091 | 64.40 | |
| Democratic | Linda S. Mrosko | 69,178 | 33.22 | |
| Libertarian | Ken Ashby | 4,961 | 2.38 | |
| Total votes | 208,230 | |||
| Republican hold | ||||
2014
| Party | Candidate | Votes | % | |
|---|---|---|---|---|
| Republican | Jeb Hensarling | 88,998 | 85.4 | |
| Libertarian | Ken Ashby | 15,264 | 14.6 | |
| Total votes | 104,262 | |||
| Republican hold | ||||
2016
| Party | Candidate | Votes | % | |
|---|---|---|---|---|
| Republican | Jeb Hensarling | 155,469 | 80.6 | |
| Libertarian | Ken Ashby | 37,406 | 19.4 | |
| Total votes | 192,875 | |||
| Republican hold | ||||
2018
| Party | Candidate | Votes | % | |
|---|---|---|---|---|
| Republican | Lance Gooden | 130,617 | 62.4 | |
| Democratic | Dan Wood | 78,666 | 37.6 | |
| Total votes | 209,283 | 100.0 | ||
| Republican hold | ||||
2020
| Party | Candidate | Votes | % | ±% | |
|---|---|---|---|---|---|
| Republican | Lance Gooden | 173,251 | 61.99 | -0.35 | |
| Democratic | Carolyn Salter | 100,413 | 35.93 | -1.62 | |
| Independent | Kevin A. Hale | 5,814 | 2.08 | +2.08 | |
| Total votes | 279,478 | 100.0 | |||
| Republican hold | Swing | ||||
Historical district boundaries
References
- https://www.census.gov/geo/maps-data/data/cd_state.html
- "My Congressional District". Retrieved June 14, 2020.
- "Partisan Voting Index – Districts of the 115th Congress" (PDF). The Cook Political Report. April 7, 2017. Retrieved April 7, 2017.
- "Texas Election Results: Fifth Congressional District". The New York Times. 2021-01-05. ISSN 0362-4331. Retrieved 2021-02-01.
- http://gis1.tlc.state.tx.us/
- Office of the Secretary of State (November 2, 2004). "Race Summary Report". 1992 - Current Election History. Texas Secretary of State. Archived from the original on November 8, 2006. Retrieved March 28, 2012.
- Office of the Secretary of State (November 7, 2006). "Race Summary Report". 1992 - Current Election History. Texas Secretary of State. Archived from the original on November 8, 2006. Retrieved March 28, 2012.
- Office of the Secretary of State (November 4, 2008). "Race Summary Report". 1992 - Current Election History. Texas Secretary of State. Archived from the original on November 8, 2006. Retrieved March 28, 2012.
- Office of the Secretary of State (November 2, 2010). "Race Summary Report". 1992 - Current Election History. Texas Secretary of State. Archived from the original on November 8, 2006. Retrieved March 28, 2012.
- Office of the Secretary of State (November 6, 2012). "Race Summary Report". 1992 - Current Election History. Texas Secretary of State. Archived from the original on November 8, 2006. Retrieved June 1, 2013.
- Martis, Kenneth C. (1989). The Historical Atlas of Political Parties in the United States Congress. New York: Macmillan Publishing Company.
- Martis, Kenneth C. (1982). The Historical Atlas of United States Congressional Districts. New York: Macmillan Publishing Company.
- Congressional Biographical Directory of the United States 1774–present