Texas's 3rd congressional district
Texas's 3rd congressional district of the United States House of Representatives is in the suburban areas north and northeast of Dallas. It encompasses much of Collin County, including McKinney, Plano, and Frisco, as well as Collin County's share of Dallas itself.
| Texas's 3rd congressional district | |||
|---|---|---|---|
.tif.png.webp) Texas's 3rd congressional district – since January 3, 2013 | |||
| Representative |
| ||
| Distribution |
| ||
| Population (2019) | 913,161[2] | ||
| Median household income | $95,619[2] | ||
| Ethnicity |
| ||
| Cook PVI | R+13[3] | ||
Texas has had at least three congressional districts since 1869. The current seat dates from a mid-decade redistricting conducted before the 1966 elections after Texas's original 1960s map was thrown out by Wesberry v. Sanders. In past configurations, it has been one of the most Republican districts in both Texas and the Dallas–Fort Worth metroplex. The GOP has held the seat since a 1968 special election. The district's current congressman is Van Taylor.
As of the 2010 census, the 3rd district represents 765,486 people who are predominantly middle-to-upper-class (median family income is US$80,912). The district is 59.1 percent White (non-Hispanic), 15.06 percent Hispanic or Latino (of any race), 13 percent Asian, and 8.9 percent Black or African American.[4]
2012 redistricting
From 1967 to 2013, the district included a large slice of northern Dallas County, including Garland, Rowlett and much of northern Dallas itself. It was pushed into Collin County in 1983. Since then, Collin County's rapid growth resulted in the district's share of Dallas County being gradually reduced.
After redistricting in 2012, the Dallas County portion of the district was removed altogether. However, it still includes the Dallas precincts located in Collin County.[5]
Voting
| Election results from presidential races | ||
|---|---|---|
| Year | Office | Results |
| 2000 | President | Bush 70 - 30% |
| 2004 | President | Bush 66 - 33% |
| 2008 | President | McCain 57 - 42% |
| 2012 | President | Romney 63 - 34% |
| 2016 | President | Trump 55 - 41% |
| 2020 | President | Trump 50 - 49% |
List of members representing the district
| Name | Party | Years | Cong ress |
Electoral history | Counties represented |
|---|---|---|---|---|---|
| American Civil War/Reconstruction | |||||
 William Thomas Clark |
Republican | March 31, 1870 – May 13, 1872 |
41st 42nd |
Elected in 1869. Lost election contest. |
[data unknown/missing] |
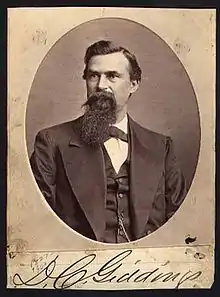
 Dewitt Clinton Giddings |
Democratic | May 13, 1872 – March 3, 1875 |
42nd 43rd |
Won election contest. [data unknown/missing] |
[data unknown/missing] |
 James W. Throckmorton |
Democratic | March 4, 1875 – March 3, 1879 |
44th 45th |
Elected in 1874. Re-elected in 1876. [data unknown/missing] |
[data unknown/missing] |
.jpg.webp) Olin Wellborn |
Democratic | March 4, 1879 – March 3, 1883 |
46th 47th |
Elected in 1878. Redistricted to the 6th district. |
[data unknown/missing] |
 James H. Jones |
Democratic | March 4, 1883 – March 3, 1887 |
48th 49th |
Elected in 1882. Re-elected in 1884. [data unknown/missing] |
[data unknown/missing] |
 Constantine B. Kilgore |
Democratic | March 4, 1887 – March 3, 1895 |
50th 51st 52nd 53rd |
Elected in 1886. Re-elected in 1888. [data unknown/missing] |
[data unknown/missing] |
| Charles H. Yoakum | Democratic | March 4, 1895 – March 3, 1897 |
54th | [data unknown/missing] | [data unknown/missing] |
 Reese C. De Graffenreid |
Democratic | March 4, 1897 – August 29, 1902 |
55th 56th 57th |
[data unknown/missing] Died. |
[data unknown/missing] |
| Vacant | August 29, 1902 – November 4, 1902 |
57th | |||
| Gordon J. Russell | Democratic | November 4, 1902 – June 14, 1910 |
57th 58th 59th 60th 61st |
[data unknown/missing] Resigned to become U.S. District Judge. |
[data unknown/missing] |
| Vacant | June 14, 1910 – July 23, 1910 |
61st | |||
| Robert M. Lively | Democratic | July 23, 1910 – March 3, 1911 |
61st | [data unknown/missing] | [data unknown/missing] |
 James Young |
Democratic | March 4, 1911 – March 3, 1921 |
62nd 63rd 64th 65th 66th |
[data unknown/missing] | [data unknown/missing] |
 Morgan G. Sanders |
Democratic | March 4, 1921 – January 3, 1939 |
67th 68th 69th 70th 71st 72nd 73rd 74th 75th |
[data unknown/missing] | [data unknown/missing] |
 Lindley Beckworth |
Democratic | January 3, 1939 – January 3, 1953 |
76th 77th 78th 79th 80th 81st 82nd |
[data unknown/missing] | [data unknown/missing] |
 Brady Preston Gentry |
Democratic | January 3, 1953 – January 3, 1957 |
83rd 84th |
[data unknown/missing] | [data unknown/missing] |
 Lindley Beckworth |
Democratic | January 3, 1957 – January 3, 1967 |
85th 86th 87th 88th 89th |
[data unknown/missing] | [data unknown/missing] |
 Joe Pool |
Democratic | January 3, 1967 – July 14, 1968 |
90th | Redistricted from the at-large seat. Died. |
[data unknown/missing] |
| Vacant | July 14, 1968 – August 24, 1968 |
||||
 James M. Collins |
Republican | August 24, 1968 – January 3, 1983 |
90th 91st 92nd 93rd 94th 95th 96th 97th |
Elected to finish Pool's term. Re-elected in 1968. Re-elected in 1970. Re-elected in 1972. Re-elected in 1974. Re-elected in 1976. Re-elected in 1978. Re-elected in 1980. Retired to run for U.S. Senator. |
[data unknown/missing] |
 Steve Bartlett |
Republican | January 3, 1983 – March 11, 1991 |
98th 99th 100th 101st 102nd |
Elected in 1982. Re-elected in 1984. Re-elected in 1986. Re-elected in 1988. Re-elected in 1990. Resigned to become Mayor of Dallas. |
[data unknown/missing] |
| Vacant | March 11, 1991 – May 8, 1991 |
102nd | |||
 Sam Johnson |
Republican | May 8, 1991 – January 3, 2019 |
102nd 103rd 104th 105th 106th 107th 108th 109th 110th 111th 112th 113th 114th 115th |
Elected to finish Bartlett's term. Re-elected in 1992. Re-elected in 1994. Re-elected in 1996. Re-elected in 1998. Re-elected in 2000. Re-elected in 2002. Re-elected in 2004. Re-elected in 2006. Re-elected in 2008. Re-elected in 2010. Re-elected in 2012. Re-elected in 2014. Re-elected in 2016. Retired.[6] |
[data unknown/missing] |
2007–2013 | |||||
| 2013–present Collin County | |||||
 Van Taylor |
Republican | January 3, 2019 – present |
116th 117th |
Elected in 2018. Re-elected in 2020. | |
Recent election results
2004
| Party | Candidate | Votes | % | |
|---|---|---|---|---|
| Republican | Sam Johnson | 178,099 | 85.56 | |
| Independent | Paul Jenkins | 16,850 | 8.10 | |
| Independent | James Vessels | 13,204 | 6.34 | |
| Total votes | 208,153 | 100.0 | ||
| Republican hold | ||||
2006
| Party | Candidate | Votes | % | ±% | |
|---|---|---|---|---|---|
| Republican | Sam Johnson | 88,634 | 62.52 | -23.04 | |
| Democratic | Dan Dodd | 49,488 | 34.91 | +34.91 | |
| Libertarian | Christopher Claytor | 3,656 | 2.58 | ||
| Majority | 39,146 | 27.61 | |||
| Turnout | 141,778 | ||||
| Republican hold | Swing | -49.44 | |||
2008
| Party | Candidate | Votes | % | ±% | |
|---|---|---|---|---|---|
| Republican | Sam Johnson | 169,557 | 59.80 | -2.72 | |
| Democratic | Tom Daley | 107,679 | 37.98 | +3.07 | |
| Libertarian | Christopher Claytor | 6,300 | 2.22 | -0.36 | |
| Majority | |||||
| Turnout | 283,536 | ||||
| Republican hold | Swing | ||||
2010
| Party | Candidate | Votes | % | ±% | |
|---|---|---|---|---|---|
| Republican | Sam Johnson | 101,180 | 66.28 | +6.48 | |
| Democratic | John Lingenfelder | 47,848 | 31.34 | -3.57 | |
| Libertarian | Christopher Claytor | 3,602 | 2.35 | +0.13 | |
| Independent | Harry Pierce | 22 | 0.01 | ||
| Majority | |||||
| Turnout | 152,652 | ||||
| Republican hold | Swing | ||||
2012
| Party | Candidate | Votes | % | |
|---|---|---|---|---|
| Republican | Sam Johnson | 187,180 | 100.0 | |
| Total votes | 187,180 | 100.0 | ||
| Republican hold | ||||
2014
| Party | Candidate | Votes | % | |
|---|---|---|---|---|
| Republican | Sam Johnson | 113,404 | 82.0 | |
| Green | Paul Blair | 24,876 | 18.0 | |
| Total votes | 138,280 | 100.0 | ||
| Republican hold | ||||
2016
Adam P. Bell was the first Democrat to run for Texas's 3rd since the redistricting effort of 2012.
| Party | Candidate | Votes | % | |
|---|---|---|---|---|
| Republican | Sam Johnson | 193,684 | 61.2 | |
| Democratic | Adam P. Bell | 109,420 | 34.6 | |
| Libertarian | Scott Jameson | 10,448 | 3.3 | |
| Green | Paul Blair | 2,915 | 0.9 | |
| Total votes | 316,467 | 100.0 | ||
| Republican hold | ||||
2018
The incumbent representative, Sam Johnson, decided not to run for reelection in 2018, after having represented Texas's 3rd since 1991. His stated reason for retiring was that "the Lord has made clear that the season of my life in Congress is coming to an end".[8]
| Party | Candidate | Votes | % | |
|---|---|---|---|---|
| Republican | Van Taylor | 169,520 | 54.2 | |
| Democratic | Lorie Burch | 138,234 | 44.2 | |
| Libertarian | Christopher Claytor | 4,604 | 1.5 | |
| Independent | Jeff Simons (write-in) | 153 | 0.1 | |
| Total votes | 312,511 | 100.0 | ||
| Republican hold | ||||
2020
| Party | Candidate | Votes | % | |
|---|---|---|---|---|
| Republican | Van Taylor | 228,648 | 55.2 | |
| Democratic | Lulu Seikaly | 177,221 | 42.8 | |
| Libertarian | Christopher J. Claytor | 8,567 | 2.0 | |
| Total votes | 414,436 | 100.0 | ||
| Republican hold | ||||
References
- https://www.census.gov/geo/maps-data/data/cd_state.html
- https://www.census.gov/mycd/?st=48&cd=03
- "Partisan Voting Index – Districts of the 115th Congress" (PDF). The Cook Political Report. April 7, 2017. Retrieved April 7, 2017.
- "My Congressional District". United States Census Bureau. Retrieved July 31, 2015.
- http://gis1.tlc.state.tx.us/
- Bland, Scott; Cheney, Kyle (January 6, 2017). "Texas Rep. Sam Johnson announces he won't run for re-election". Politico. Retrieved August 8, 2017.
- "Texas Election Results". Texas Secretary of State. Retrieved December 5, 2018.
- Leslie, Katie (January 2017). "Plano Rep. Sam Johnson to retire when term ends in 2018". The Dallas Morning News. Retrieved July 2, 2019.
- Martis, Kenneth C. (1989). The Historical Atlas of Political Parties in the United States Congress. New York: Macmillan Publishing Company.
- Martis, Kenneth C. (1982). The Historical Atlas of United States Congressional Districts. New York: Macmillan Publishing Company.
- Congressional Biographical Directory of the United States 1774–present
- Texas Secretary of State 2010 General Election Statewide Race Summary