Rong County, Sichuan
Rong County or Rongxian is a county of Sichuan Province, China. It is under the administration of Zigong city.
Rong County
荣县 | |
|---|---|
.png.webp) Location of Rong County (red) within Zigong City (yellow) and Sichuan | |
| Coordinates: 29°26′43″N 104°25′03″E | |
| Country | People's Republic of China |
| Province | Sichuan |
| Prefecture-level city | Zigong |
| Area | |
| • Total | 1,598.97 km2 (617.37 sq mi) |
| Time zone | UTC+8 (China Standard) |
| Rongxian | |||||||||
|---|---|---|---|---|---|---|---|---|---|
| Traditional Chinese | 榮縣 | ||||||||
| Simplified Chinese | 荣县 | ||||||||
| Postal | Junghsien | ||||||||
| |||||||||
Geography
The county has a total area of 1,609 km2 (621 sq mi). The average elevation above sea level of county is 230 m.
Climate
| Climate data for Rongxian (1981−2010) | |||||||||||||
|---|---|---|---|---|---|---|---|---|---|---|---|---|---|
| Month | Jan | Feb | Mar | Apr | May | Jun | Jul | Aug | Sep | Oct | Nov | Dec | Year |
| Record high °C (°F) | 19.4 (66.9) |
23.6 (74.5) |
31.9 (89.4) |
34.6 (94.3) |
37.3 (99.1) |
37.7 (99.9) |
37.5 (99.5) |
39.7 (103.5) |
37.9 (100.2) |
31.0 (87.8) |
25.7 (78.3) |
19.3 (66.7) |
39.7 (103.5) |
| Average high °C (°F) | 10.2 (50.4) |
12.7 (54.9) |
17.4 (63.3) |
23.0 (73.4) |
27.1 (80.8) |
28.5 (83.3) |
30.8 (87.4) |
30.7 (87.3) |
26.4 (79.5) |
21.2 (70.2) |
16.9 (62.4) |
11.4 (52.5) |
21.4 (70.5) |
| Daily mean °C (°F) | 7.3 (45.1) |
9.5 (49.1) |
13.3 (55.9) |
18.3 (64.9) |
22.4 (72.3) |
24.4 (75.9) |
26.5 (79.7) |
26.2 (79.2) |
22.6 (72.7) |
18.0 (64.4) |
13.8 (56.8) |
8.7 (47.7) |
17.6 (63.6) |
| Average low °C (°F) | 5.2 (41.4) |
7.2 (45.0) |
10.4 (50.7) |
14.8 (58.6) |
18.8 (65.8) |
21.2 (70.2) |
23.3 (73.9) |
23.0 (73.4) |
20.1 (68.2) |
15.9 (60.6) |
11.6 (52.9) |
6.8 (44.2) |
14.9 (58.7) |
| Record low °C (°F) | −2.2 (28.0) |
−0.7 (30.7) |
0.8 (33.4) |
6.7 (44.1) |
10.0 (50.0) |
15.1 (59.2) |
18.1 (64.6) |
16.4 (61.5) |
13.9 (57.0) |
5.6 (42.1) |
2.9 (37.2) |
−1.7 (28.9) |
−2.2 (28.0) |
| Average precipitation mm (inches) | 9.6 (0.38) |
15.4 (0.61) |
27.8 (1.09) |
59.7 (2.35) |
92.9 (3.66) |
158.1 (6.22) |
188.4 (7.42) |
201.0 (7.91) |
104.0 (4.09) |
46.1 (1.81) |
22.4 (0.88) |
8.1 (0.32) |
933.5 (36.74) |
| Average relative humidity (%) | 82 | 80 | 75 | 74 | 72 | 80 | 82 | 81 | 83 | 84 | 82 | 82 | 80 |
| Source: China Meteorological Data Service Center[1] | |||||||||||||
History
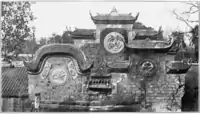
A Temple in Yong-hien, the city below the Great Buddha in 1910
See also
References
- 中国地面气候标准值月值(1981-2010) (in Chinese). China Meteorological Data Service Center. Retrieved 20 October 2018.
External links
| Authority control |
|---|
This article is issued from Wikipedia. The text is licensed under Creative Commons - Attribution - Sharealike. Additional terms may apply for the media files.