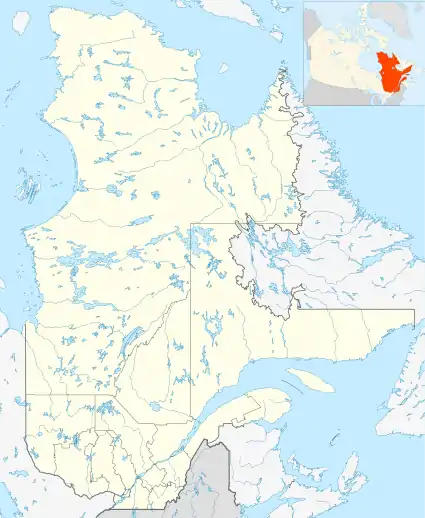
Poste Montagnais, Quebec
Poste Montagnais is a community in Quebec. It is served by the Poste Montagnais Airport. Its mainly serves the Hydro-Québec's electrical substation, "Poste Montagnais" (Montagnais Substation) in the Côte-Nord region, approximately 12 km (7.5 mi) south of the border of Labrador. It is located in the extreme western part of the Minganie Regional County Municipality, Quebec.

Climate
Poste Montagnais has a subarctic climate (Köppen climate classification Dfc), with long cold winters and short warm summers. The warmest temperature recorded was 33 °C (91.40 °F) on June 23, 1989. The coldest temperature recorded was −50 °C (−58.00 °F) on January 30, 1976. Poste Montagnais has pretty much uniform precipitation throughout the year with slightly more in the summer months. During the winter Poste Montagnais accumulates 286.1 centimetres (112.64 in) of snow which melts in the spring.[1]
| Climate data for Poste Montagnais (1971–2000 normals) | |||||||||||||
|---|---|---|---|---|---|---|---|---|---|---|---|---|---|
| Month | Jan | Feb | Mar | Apr | May | Jun | Jul | Aug | Sep | Oct | Nov | Dec | Year |
| Record high °C (°F) | 5.5 (41.9) |
7.8 (46.0) |
13.9 (57.0) |
17.8 (64.0) |
28 (82) |
33 (91) |
32.2 (90.0) |
32.2 (90.0) |
27.2 (81.0) |
18.9 (66.0) |
10 (50) |
5 (41) |
33 (91) |
| Average high °C (°F) | −16.1 (3.0) |
−13.1 (8.4) |
−6 (21) |
1.9 (35.4) |
9.2 (48.6) |
16.7 (62.1) |
19.5 (67.1) |
18.1 (64.6) |
11.2 (52.2) |
3 (37) |
−4.5 (23.9) |
−12.7 (9.1) |
2.3 (36.1) |
| Daily mean °C (°F) | −23.3 (−9.9) |
−20.9 (−5.6) |
−13.3 (8.1) |
−4.3 (24.3) |
3.2 (37.8) |
9.9 (49.8) |
13.2 (55.8) |
11.9 (53.4) |
6 (43) |
−1 (30) |
−9.4 (15.1) |
−19.4 (−2.9) |
−3.9 (25.0) |
| Average low °C (°F) | −30.4 (−22.7) |
−28.6 (−19.5) |
−20.6 (−5.1) |
−10.5 (13.1) |
−2.8 (27.0) |
3.2 (37.8) |
6.9 (44.4) |
5.8 (42.4) |
0.8 (33.4) |
−5.1 (22.8) |
−14.3 (6.3) |
−26 (−15) |
−10.1 (13.8) |
| Record low °C (°F) | −50 (−58) |
−49 (−56) |
−47 (−53) |
−36.1 (−33.0) |
−20 (−4) |
−10 (14) |
−3.3 (26.1) |
−5 (23) |
−13.9 (7.0) |
−22.8 (−9.0) |
−37 (−35) |
−48.9 (−56.0) |
−50 (−58) |
| Average precipitation mm (inches) | 51.5 (2.03) |
29 (1.1) |
34.5 (1.36) |
34.3 (1.35) |
54.1 (2.13) |
89.2 (3.51) |
116.1 (4.57) |
102.2 (4.02) |
96.4 (3.80) |
71.2 (2.80) |
55 (2.2) |
56.9 (2.24) |
790.4 (31.12) |
| Average snowfall cm (inches) | 51.4 (20.2) |
26.4 (10.4) |
33.1 (13.0) |
29.9 (11.8) |
12.0 (4.7) |
0.3 (0.1) |
0.0 (0.0) |
0.0 (0.0) |
2.9 (1.1) |
25.5 (10.0) |
48.7 (19.2) |
56.0 (22.0) |
286.1 (112.6) |
| Source: Environment Canada[1] | |||||||||||||
References
- "Canadian Climate Normals Temperature and Precipitation Graph for 1971 to 2000". Environment Canada. Government of Canada. Retrieved January 19, 2017.