Mississippi River floods of 2019
Flooding in the Mississippi River Basin during the winter, spring, and summer of 2019 caused at least 12 deaths and economic losses in 19 states totaling in excess of $20 billion.[1][2] Estimated damages in the Midwestern United States alone had reached $12.5 billion by April 2019.[3][4] Flood damages totaling $6.2 billion were reported in the 11 states bordering the Mississippi River.[1][2] In addition to property and crop losses and infrastructure damages, commercial navigation on the Mississippi River was interrupted repeatedly by high currents, low bridge clearances, and closed locks. This delayed shipments of agricultural commodities, adding to the economic stress of crop losses caused by flooding. As of late April 2019, shipments of corn to export terminals in Louisiana were 31% lower than in same period in 2018.[5][6]
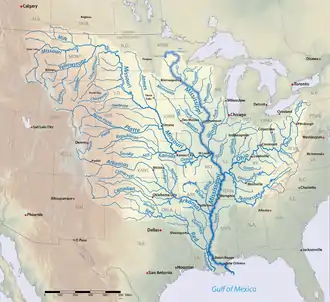
Flooding along the Mississippi River was not the result of a single weather event. Instead, a series of flood events in tributary basins produced Mississippi River flooding of record duration. Flooding along the Tennessee and Ohio Rivers in the winter was followed by catastrophic floods in portions of the Midwestern United States in the early spring and record flooding along the Arkansas River in late May. While the Mississippi River floods of 2019 set records for duration and total volume, only a few locations along the Mississippi River saw record stages or flows.
Meteorology
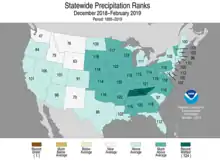
The conterminous United States recorded the wettest meteorological winter (December 2018 - February 2019) during the 1895-2019 period of record, with an average of 9.09 inches (231 mm) of precipitation.[7][8] Tennessee experienced its wettest meteorological winter receiving 25.19 inches (640 mm) of precipitation. Winter precipitation ranked in the top 10 out of 124 years in 15 states within the Mississippi River Basin.[9] Heavy rainfall and subsequent flooding near the end of February 2019 in the Tennessee, Cumberland, Ohio, and Yazoo River basins increased flooding on the Lower Mississippi River.[10][11][12]
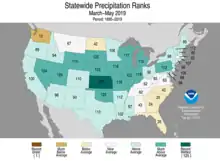
Wetter than normal conditions persisted into the spring with precipitation concentrated in the western and northern regions of the Mississippi River Basin. The conterminous United States recorded the fifth wettest meteorological spring (March 2019 - May 2019) during the 1895-2019 period of record, with an average of 9.92 inches (252 mm) of precipitation.[13] Kansas experienced its wettest meteorological spring receiving 14.31 inches (363 mm) of precipitation of which 10.51 inches (267 mm) fell in May.
In mid-March, snow-melt accelerated by heavy rain and rapidly warming temperatures resulted in catastrophic flooding in portions of the Midwestern United States. The most extreme flooding occurred along the tributaries of the Missouri River, the largest tributary (by area) of the Mississippi River.
The 12-month period ending in April 2019 was the wettest to date during the 1895-2019 period of record, with an average of 36.27 inches (921 mm) of precipitation over the conterminous United States. Most states in the Mississippi River Basin experienced above average precipitation.[14][15]
In late-May, much of the Mid-west received over three inches of rainfall over a one-week period. Heavy rainfall in Oklahoma, with some parts of north-east Oklahoma receiving over 20 inches (510 mm) of rainfall over a 30-day period, produced record flooding along portions of the Arkansas River, the largest tributary of the Lower Mississippi River downstream of its confluence with the Ohio River.[16][17] May was the second wettest month on record over the conterminous United States. Precipitation over the 12-month period ending in May averaged 37.72 inches (958 mm) surpassing the record set one month earlier.[18]
Wetter than normal weather continued into June, and for the third month in a row, a new record was set for 12-month precipitation averaged over the conterminous United States. For the 12-month period ending in June, precipitation totaled 37.93 inches (963 mm) exceeding the previous records set in April and May by 1.66 inches (42 mm) and 0.21 inches (5.3 mm) respectively.[19]
Hurricane Barry
Normally, floods on the Lower Mississippi River occur in the winter and spring, and thus are unlikely to overlap with the Atlantic hurricane season. The development in early July of 2019 of the storm that would become Hurricane Barry briefly prompted concerns that a storm surge propagating up the Mississippi River could increase already high river stages and overtop river levees as far upstream as New Orleans, Louisiana.[20] On 13 July 2019, Hurricane Barry came ashore as a minimal hurricane near Intracoastal City, Louisiana over 100 miles (160 km) west of New Orleans. The resulting storm surge and heavy rains briefly increased river stages at New Orleans from about 16 feet (4.9 m) to nearly 17 feet (5.2 m). The peak stage was about 3 feet (0.91 m) below the top of the levee.[21]
Upper Mississippi River

Multiple locations along the Upper Mississippi River experienced record flooding. At Dubuque, Iowa, the Mississippi River was above flood stage for 85 days, eclipsing the previous record of 34 days set in 2011.[22]
River stages at the Quad Cities of Iowa and Illinois were above major flood stage for 51 days exceeding the previous record of 31 days set in 2001.[23] The river remained above flood stage levels for over 96 days.[24] The crest of 22.7 feet (6.9 m) on 2 May 2019 was nearly a tenth of a foot above the record stage set in 1993. Temporary flood barriers failed on 30 April 2019 flooding portions of downtown Davenport, Iowa.[23][25][26]
In Burlington, Iowa, the Mississippi rose above its banks for more than 104 days,[24] exceeding its previous record of 41 days at major flood stage, set in 1993.[27] The peak river stage of 23.5 feet (7.2 m) was the fourth highest on record.[23] On the afternoon of 1 June 2019, a temporary flood barrier failed forcing evacuation of multiple businesses in a 4 to 5 block area of downtown Burlington.[28] At Hannibal, Missouri, the crest of 30.2 feet (9.2 m) on 1 June 2019 was surpassed only by the record stage of 31.8 feet (9.7 m) in 1993.[23]
The Pin Oak levee in Lincoln County, Missouri overtopped in early hours of Sunday morning, 2 June 2019, and breached that afternoon. Approximately 250 people were forced to evacuate as flooding threatened or isolated about 150 homes in Winfield, Missouri, and surrounding areas.[29]
Middle Mississippi River
The Mississippi River crested at 45.9 feet (14.0 m) on 8 June 2019 in St. Louis, Missouri, the second highest stage on record. The record crest of 49.6 feet (15.1 m) was set in 1993.[22][30]
The Mississippi River at Chester, Illinois crested above flood stage three times during 2019. The third crest of 46.5 feet (14.2 m) on 10 June 2019 was exceeded only by the record stage of 49.6 feet (15.1 m) recorded during the Great Flood of 1993.[31]
Lower Mississippi River

River stages at many locations along the Lower Mississippi River exceeded flood stage between December 2018 and February 2019 and remained above flood stage through late summer.[32] The duration of flooding at Greenville, Mississippi, and Red River Landing and Baton Rouge, Louisiana, exceeded the records set by the Great Mississippi Flood of 1927. The Red River Landing gauge was above flood stage for 226 days from 28 December 2018 until 10 August 2019. The Baton Rouge gauge was above flood stage for 211 days from 6 January 2019 until 4 August 2019. At Vicksburg, Mississippi, the Mississippi River was above flood stage for longest period since 1927.[33][25] In May of 2019, the Mississippi Department of Wildlife, Fisheries, and Parks reported that seven Wildlife Management Areas have been flooded since January with some inundated by 15 feet of water.[34]
Streamflow
Over water year 2019, the annual mean river discharge at Memphis, Tennessee, was 1,001,000 cubic feet per second (28,300 m3/s), the highest value in the 1933 to 2019 period of record and almost twice the long-term average. Mean monthly river discharges exceeded the long-term average for each month in the water year and set new records in October and November of 2018 and March and June of 2019. The peak discharge of 1,730,000 cubic feet per second (49,000 m3/s) recorded on 4 March 2020 was almost 88% of the record discharge during the Great Flood of 1937.[35]
At Vicksburg, Mississippi, tributary inflows from the St. Francis, White, Arkansas, and Yazoo Rivers increased the annual mean discharge to 1,211,000 cubic feet per second (34,300 m3/s). This mean discharge was equal to an annual water volume of 877 million acre-feet or 259 cubic miles (1.08×10¹² m3).[36]
Flow diversions at the Old River Control Structure reduced the mean annual discharge at Baton Rouge, Louisiana, to 949,000 cubic feet per second (26,900 m3/s) which was approximately 60% greater than the average discharge of the Mississippi River into the Gulf of Mexico. This mean discharge during water year 2019 was equal to an annual volume of 687 million acre-feet or 203 cubic miles (8.5×10¹¹ m3).[37]
Yazoo Backwater Area, Mississippi Delta
%252C_23_March_2019.png.webp)
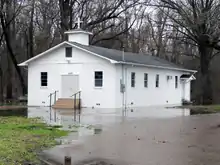
The Yazoo Backwater Area in the Mississippi Delta north of Vicksburg, Mississippi, experienced both record flood stages and record duration of flooding during the winter, spring, and summer of 2019. Portions of Warren, Issaquena, Sharkey, Yazoo, Humphreys, and Washington Counties were flooded. Almost half of the land area of Issaquena and Sharkey Counties experienced flooding. In late May, flood waters covered over 860 square miles (550,000 acres or 220,000 hectares), including about 390 square miles (250,000 acres or 100,000 hectares) of farmland. In a region where farming is the primary economic activity, farmers were unable to plant crops as flooding extended past planting deadlines.[34]
In his letter of 19 July 2019 requesting a major, federal disaster declaration, Mississippi Governor Phil Bryant wrote “To say that the persistent flooding in these five Mississippi Delta counties has had a devastating impact on the lives of many Mississippians would be a gross understatement.” He noted that prolonged flooding was impacting the livelihood of thousands of agricultural workers in one of the most impoverished areas of the United States. Agricultural losses in the Yazoo Backwater Area were projected to exceed $800,000,000 with reported crop losses already reaching $648,000,000.[38]
The Mississippi Emergency Management Agency reported that 222 homes were destroyed and an additional 482 homes were damaged by flooding.[39] The extreme duration of flooding complicated attempts to erect and maintain temporary flood barriers around homes and communities as peak water levels could not be predicted months in advance. Officials in Issaquena County reported that all but 1.5 miles (2.4 km) of 86 miles (138 km) of county roads had been flooded and that some residents had been displaced since February. The Emergency Management Director in Sharkey County reported that 35 county roads were closed and 120 people had been displaced from 72 homes. Portions of state highways 1, 16, and 465 were closed at various times during the flood. U.S. Highway 61 between Redwood and Onward, Mississippi, was the only major road not closed at some time by flooding despite being surrounded by flood waters over most of this route. The first flood related fatatlities in the Yazoo Backwater Area occurred on 17 June 2019 when a man and a pregnant woman drowned after their car skidded off Satartia Road near Holly Bluff and sank in flood waters surrounding the road.[34][40][41]
Eagle Lake, Mississippi
The Eagle Lake community, in northwestern Warren County, Mississippi, succumbed to flood water ponding in the Yazoo Backwater Area over the weekend of 18 May 2019. Temporary flood barriers that had been emplaced and steadily enlarged since mid-March by residents, volunteers, and prison labor, were overwhelmed by wind driven waves and steadily rising water levels, which had reached an elevation of 97.8 feet (29.8 meters). Water levels peaked at 98.2 feet (29.9 meters) on 23 May 2019, the highest level since completion of the Yazoo Backwater Levee in 1978. The previous record of 96.5 feet (29.4 meters) set on 4 May 1979 was surpassed on 17 March 2019. Eagle Lake has about 300 full-time residents and another 200 part-time residents. Flooding damaged 438 structures in the Eagle Lake community.[42][43][44][45][46]
Pumping Station Controversy
The Yazoo Backwater Area is protected from flooding by the Mississippi River Levee along the Mississippi River and the Yazoo Backwater Levee along the Yazoo River. Normally, streams within the Yazoo Backwater Area flow into the Yazoo River through the Steele Bayou Drainage Structure and the Little Sunflower River Drainage Structure. The Steele Bayou and Little Sunflower River Drainage Structures can discharge up to 19,000 and 8,000 cubic feet per second (540 and 230 cubic meters per second) respectively into the Yazoo River. During floods on the Mississippi River, these drainage structures must be closed to prevent backwater flooding from the Mississippi River. However, when these structures are closed, rainfall in the Steele Bayou, Deer Creek, Little Sunflower River, and Sunflower River watersheds ponds on the protected side of the levees causing interior flooding.[Notes 1] When water levels on the river side of the Yazoo Backwater Levee fall below the interior flood level, the drainage structures are opened to permit evacuation of the ponded flood waters.[47][48]
The system of flood protection authorized for the Yazoo Backwater Area by the Flood Control Act of 1941 included a pumping system to relieve interior flooding. In 2008, the United States Environmental Protection Agency (EPA) blocked construction of a 14,000 cubic feet per second (396 cubic meters per second) pumping station recommended by the United States Army Corps of Engineers (USACE). The EPA determined that the proposed pumping station would adversely impact 105 square miles (67,000 acres or 27,000 hectares) of wetlands. The USACE plan included provisions for reforestation of up to 87 square miles (55,600 acres or 22,500 hectares) of developed, low-lying lands that would not be protected from flooding by the proposed pumping station.[47][48][49] The Yazoo Backwater Inundation Map, With and Without Pump, published by the Mississippi Levee Board, indicates that the proposed pumping station would have reduced water levels by nearly 5 feet in mid-March 2019 and reduced the flooded area by about one-third.
Flood Timeline
The Mississippi River exceeded flood stage at Vicksburg on 10 January 2019, then fell back below flood stage on 22 January 2019, before rising above flood stage again on 15 February 2019. During this first event, water levels on the protected side of the Steele Bayou Drainage Structure peaked at 91.5 feet (27.9 meters) then fell back to 89.2 feet (27.2 meters). The Steele Bayou Drainage Structure was closed from 15 February 2019 to 1 April 2019, and water levels on the protected side peaked at 97.2 feet (29.6 meters). Water levels fell to 95.4 feet (29.1 meters) before a new rise on Mississippi River forced closure of the Steele Bayou Drainage Structure from 11 to 23 May 2019. Water levels peaked at 98.2 feet (29.9 meters) on 23 May 2019 then fell to 97.6 feet (29.7 meters) in early June before the Steele Bayou Drainage Structure was closed for a third time on 7 June 2019 in response to a new rise on the Mississippi River. The Steele Bayou Drainage Structure was reopened on 20 June 2019 after the Mississippi River fell below 49.3 feet at the Vicksburg gage. The Little Sunflower River Drainage Structure which had been closed since 4 May 2019 was reopened on 22 June 2019.[Notes 2] The Steele Bayou Drainage Structure was closed again briefly from 7 to 11 July 2019 as the Mississippi River rose to 49.6 feet (15.1 m) on the Vicksburg gage, pushing water levels on the river side of the structure slightly above levels on the protected side. A sustained fall over the remainder of July dropped the Mississippi River stage at Vicksburg below flood stage on 29 July 2019. This fall permitted significant drainage of ponded water through the Steele Bayou and Little Sunflower River Drainage Structures allowing water levels in the Yazoo Backwater Area to fall below record levels in late July.[50][51][52][53][54][55][56]
Morganza Control Structure
In late May 2019, the U.S. Army Corps of Engineers announced plans to operate the Morganza Control Structure in early June to prevent overtopping of the structure and reduce river stages along Mississippi River levees. The proposed operation would have diverted 150,000 cfs from the Mississippi River into the Morganza Floodway. The planned operation was postponed (and eventually cancelled) when subsequent forecasts indicated that stages would be lower than originally predicted.[57][58]
Bonnet Carre' Spillway
The Bonnet Carre' Spillway was opened on 27 February 2019 for the first time in two consecutive years. The Spillway diverts part of the flow of the Mississippi River into Lake Pontchartrain. The Spillway is operated to limit the Mississippi River flow passing New Orleans, Louisiana, to the project design flood discharge of 1.25 million cubic feet per second (cfs). The peak diversion discharge through the Spillway of 213,000 cfs occurred on 19 March 2019. The Spillway was closed on 10 April 2019. The average diversion discharge was approximately 140,000 cfs.[59]
The Bonnet Carre' Spillway was reopened on 10 May 2019 marking the first time that the Spillway has been operated twice in the same year. The peak diversion discharge of 161,000 cfs occurred on 21-22 May 2019. The Spillway was closed on 27 July 2019. The average diversion discharge was approximately 120,000 cfs.[60][59]
See also
Notes
- The total drainage area of the watersheds contributing to interior ponding in the Yazoo Backwater Area is 4,093 square miles (10,600 square kilometers).
- The Little Sunflower River Drainage Structure is located upstream of the Steele Bayou Drainage Structure. Therefore, the Little Sunflower River Drainage Structure may be operated earlier or later than the Steele Bayou Drainage Structure as dictated by differences in water levels. Operation of the smaller Little Sunflower River Drainage Structure is not routinely reported.
References
- "U.S. Billion-Dollar Weather and Climate Disasters (2020)". National Centers for Environmental Information. NOAA. Retrieved 16 January 2020.
- Gwinner, Jim (5 March 2020). "Mississippi River Mayors AmplifyStaggering 2019 Flood Costs, Unveil Federal Policy Priorities, and Preview Flood Risk Outlook for 2020" (PDF). Mississippi River Cities and Towns Initiative. Retrieved 13 April 2020.
- Cusick, Daniel. "Today's Floods Occur along "a Very Different" Mississippi River". Climatewire. E&E News. Retrieved 2 June 2019.
- Roach, John (5 April 2019). "Flood damage and economic loss in the heartland to reach $12.5 billion this spring". AccuWeather Weather News. AccuWeather, Inc. Retrieved 4 July 2019.
- Sullivan, Brian K.; Singh, Shruti; Parker, Mario (10 June 2018). "Hundreds of Barges Stalled as Floods Hinder Midwest Supplies". Bloomberg. Retrieved 5 July 2019.
- Moore, Kirk (3 May 2019). "Coast Guard closes five miles on Mississippi after St. Louis bridge allision". Workboat. Retrieved 5 July 2019.
- Henson, Bob. "Wettest Winter in U.S. History". Category 6. Weather Underground. Retrieved 13 May 2019.
- "Climate at a Glance; National Time Series". National Centers for Environmental Information. NOAA. Retrieved 13 May 2019.
- "National Temperature and Precipitation Maps". National Centers for Environmental Information. NOAA. Retrieved 13 May 2019.
- Henson, Bob. "Serious Flooding Threat Looms for Tennessee Valley This Week and Beyond". Category 6. Weather Underground. Retrieved 18 February 2019.
- Masters, Jeff. "A Wild Weather Weekend in the U.S. Brings Damaging Winds, Flooding, Tornadoes, and Heavy Snow". Category 6. Weather Underground. Retrieved 25 February 2019.
- Masters, Jeff. "Mississippi River's Bonnet Carre Spillway Opens For 13th Time Since 1931". Category 6. Weather Underground. Retrieved 27 February 2019.
- "Climate at a Glance: National Time Series". NOAA National Centers for Environmental information. Retrieved 9 June 2019.
- Henson, Bob. "Wettest 12 Months in U.S. History". Category 6. The Weather Company. Retrieved 2 June 2019.
- "National Temperature and Precipitation Maps". NOAA National Centers for Environmental Information. Retrieved 2 June 2019.
- Masters, Jeff. "Historic Flooding on the Arkansas River in Oklahoma and Arkansas". Category 6. The Weather Company. Retrieved 2 June 2019.
- Masters, Jeff. "Mississippi River's Morganza Spillway Expected to Open For 3rd Time in History". Category 6. The Weather Company. Retrieved 2 June 2019.
- Henson, Bob. "Wettest 12 Months in U.S. History—Again". Category 6. The Weather Company. Retrieved 8 June 2019.
- Henson, Bob (9 July 2019). "Wettest 12 Months in U.S. History, Yet Again". Category 6. Weather Underground. Retrieved 11 July 2019.
- Masters, Jeff (10 July 2019). "New Orleans' Achilles Heel: A Hurricane Storm Surge During a Mississippi River Flood?". Category 6. The Weather Company. Retrieved 6 October 2019.
- Masters, Jeff (13 July 2019). "Barry Makes Landfall over South Central Louisiana". Category 6. The Weather Company. Retrieved 6 October 2019.
- Lampe, Nelson (13 June 2019). "Mississippi River dropping below flood stage in Iowa". Associated Press. Retrieved 23 June 2019.
- NWS Internet Services Team. "Advanced Hydrologic Prediction Service". River Observations. NOAA National Weather Service. Retrieved 2 June 2019.
- Gerlock, Grant (June 25, 2019). "As Water Recedes, River Cities Tally Flood Damage". Iowa Public Radio. Retrieved 2019-09-22.
- Donegan, Brian (14 May 2019). "2019 Mississippi River Flood the Longest-Lasting Since the Great Flood of 1927". Weather Underground News. The Weather Company. Retrieved 21 May 2019.
- Salter, Jim; Hollingsworth, Heather (3 May 2019). "4 dead in Midwest flooding as Illinois braces for Mississippi River levels not seen since 1993". Chicago Tribune. Retrieved 2 June 2019.
- Satre, Zane (17 May 2019). "Record stretch of major flood stage finally ends in Burlington". Our QuadCities.com. Nexstar Broadcasting, Inc. Retrieved 2 June 2019.
- Grabenstein, Hannah (1 June 2019). "In central US, levee breaches flood some communitie". The Associated Press. Retrieved 16 June 2019.
- KMOV.com staff (3 June 2019). "Pin Oak levee near Winfield breached, 250 people evacuated". St. Louis, MO: KMOV News 4. Retrieved 16 June 2019.
- "Mississippi River at St. Louis, MO". Rvergages.com. US Army Corps of Engineers. Retrieved 23 June 2019.
- "NWS North Central River Forecast Center". NOAA National Weather Service. Retrieved 30 June 2019.
- "River Gages". US Army Corps of Engineers. Retrieved 13 May 2019.
- "Mississippi River Flood History 1543-Present". New Orleans/Baton Rouge Weather Forecast Office. NOAA; National Weather Service. Retrieved 11 August 2019.
- Frazier, Desare (23 May 2019). "Mississippi Edition". MPB News. Mississippi Public Broadcasting. Retrieved 8 June 2019.
- "USGS: Water-Year Summary for Site USGS 07032000". US Geological Survey. Retrieved 26 July 2020.
- "USGS: Water-Year Summary for Site USGS 07289000". US Geological Survey. Retrieved 26 July 2020.
- "USGS: Water-Year Summary for Site USGS 07374000". US Geological Survey. Retrieved 24 July 2020.
- Reeves, Tim (22 July 2019). "Bryant calls on Trump to declare a major disaster in Delta counties". The Vicksburg Post. Retrieved 20 October 2019.
- Kenney, David (4 September 2019). "The numbers are in: 222 homes were destroyed due to flooding in the Delta". WLOX. Retrieved 20 October 2019.
- O’Dowd, Peter (7 June 2019). "'I Tried To Stay And Hold On As Long As I Could': Returning To A Flooded Mississippi Home". Here & Now. WBUR-FM. Retrieved 8 June 2019.
- Rozier, Alex (May 15, 2019). "The Homeland and the Wetlands: The Yazoo backwater fight rages". Mississippi Today. Retrieved 19 May 2019.
- Associated Press (21 May 2019). "Mississippi Flood Overwhelms Miles-Long Sandbag Wall". Jackson Free Press. Retrieved 23 May 2019.
- Surratt, John (26 March 2019). "Backwater level goes above 97 feet; expected to rise more". The Vicksburg Post. Retrieved 23 May 2019.
- Lauritzen, Reagan (18 May 2019). "Vicksburg District Predicts Yazoo Backwater Area to Reach 98 to 98.5 Feet: Eagle Lake Potentially to Equalize with the Backwater Area". Vicksburg, MS. US Army Corps of Engineers. Retrieved 19 May 2019.
- Hadaway, Catherine (5 July 2019). "Floodwaters inch lower, but access still weeks away". The Vicksburg Post. Retrieved 9 July 2019.
- Fowler, Sarah (17 June 2019). "Couple dies after car 'immediately' sinks in Mississippi floodwaters". Mississippi Clarion Ledger. Retrieved 10 July 2019.
- "Yazoo Backwater Project". Mississippi Levee Board. Retrieved 8 June 2019.
- "Yazoo Backwater Area Reformulation Study". US Army Corps of Engineers,Vicksburg District. October 2007. Retrieved 8 June 2019.
- "Yazoo Backwater Area Pumps Project". United States Environmental Protection Agency. 31 August 2008. Retrieved 8 June 2019.
- "Floodgate closes again as Mississippi Delta flood continues". The Associated Press. 7 June 2019. Retrieved 8 June 2019.
- "Steele Bayou Control Structure (landside), MS". Rivergages.com. US Army Corps of Engineers. Retrieved 8 June 2019.
- "Mississippi River @ Vicksburg, MS". Rivergages.com. US Army Corps of Engineers. Retrieved 8 June 2019.
- Dulaney, Jessica (20 June 2019). "Vicksburg District opens Steele Bayou Control Structure gates, anticipates the opening of the Little Sunflower Control Structure". US Army Corps of Engineers, Vicksburg District. Retrieved 23 June 2019.
- Dulaney, Jessica (24 June 2019). "Vicksburg District opens Little Sunflower Control Structure, Muddy Bayou Control Structure Gates". US Army Corps of Engineers, Vicksburg District. Retrieved 30 June 2019.
- Surratt, John (8 July 2019). "Steele Bayou closed once again as flooding persists". The Vicksburg Post. Retrieved 9 July 2019.
- Surratt, John (11 July 2019). "Up to 10 inches of rain expected from Barry". The Vicksburg Post. Retrieved 12 July 2019.
- "USACE to operate Morganza Control Structure". U.S. Army Corps of Engineers, New Orleans District. 28 May 2019. Retrieved 16 June 2019.
- Boyett, Ricky (6 June 2019). "UPDATE: OPERATION OF THE MORGANZA FLOODWAY POSTPONED". US Army Corps of Engineers, New Orleans District. Retrieved 16 June 2019.
- "Spillway Operational Effects". US Army Corps of Engineers; New Orleans District. Retrieved 10 August 2019.
- Calder, Chad; Roberts III, Faimon A. (10 May 2019). "Bonnet Carre Spillway reopened Friday due to fast-swelling Mississippi River; flood warning issue". The Advocate. Retrieved 13 May 2019.