Minnesota's 1st congressional district
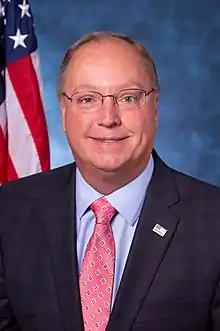
Minnesota's 1st congressional district extends across southern Minnesota from the border with South Dakota to the border with Wisconsin. The first district is primarily a rural district built on a strong history of agriculture, although this is changing rapidly due to strong population growth in Rochester and surrounding communities. The first district is also home to several of Minnesota's major mid-sized cities, including Rochester, Mankato, Winona, Austin, Owatonna, Albert Lea, New Ulm, and Worthington. This district is currently represented by Republican Jim Hagedorn of Blue Earth.
| Minnesota's 1st congressional district | |||
|---|---|---|---|
.tif.png.webp) Minnesota's 1st congressional district - since January 3, 2013. | |||
| Representative |
| ||
| Area | 13,322[1] sq mi (34,500 km2) | ||
| Distribution |
| ||
| Population (2019) | 679,003[3] | ||
| Median household income | $66,330[4] | ||
| Ethnicity | |||
| Cook PVI | R+5[6] | ||
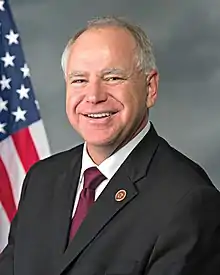
From early statehood until the latest redistricting after the 2000 census, the first district covered only southeast Minnesota. During the 20th century it was generally considered solidly Republican, though it became more of a swing district in the late 20th to early 21st century. In 2004, John Kerry received 48% of the vote in this Congressional district. Two years later, in 2006, Republican Representative Gil Gutknecht was defeated by Democrat Tim Walz. In March 2017, Walz announced that he would not run for reelection to Congress, and instead would run for governor of Minnesota. On paper, the district leans Republican with a CPVI of R+5, but recent elections have been among the closest in the nation, being won by less than a single percentage point in both 2016 and 2018.[6]
List of members representing the district
Recent elections
| Party | Candidate | Votes | % | ±% | |
|---|---|---|---|---|---|
| Republican | Gil Gutknecht (Incumbent) | 163,532 | 61 | - | |
| Democratic (DFL) | Steve Andreasen | 92,149 | 35 | - | |
| Green | Gregory Mikkelson | 9,954 | 4 | - | |
| Party | Candidate | Votes | % | ±% | |
|---|---|---|---|---|---|
| Republican | Gil Gutknecht (Incumbent) | 193,132 | 60 | -1 | |
| Democratic (DFL) | Leigh Pomeroy | 115,088 | 35 | - | |
| Independence | Gregory Mikkelson | 15,569 | 5 | - | |
| Party | Candidate | Votes | % | ±% | |
|---|---|---|---|---|---|
| Democratic (DFL) | Tim Walz | 141,622 | 53 | - | |
| Republican | Gil Gutknecht (Incumbent) | 126,487 | 47 | -13 | |
| Party | Candidate | Votes | % | ±% | |
|---|---|---|---|---|---|
| Democratic (DFL) | Tim Walz (Incumbent) | 207,748 | 62.5 | +9.5 | |
| Republican | Brian J. Davis | 109,446 | 32.9 | - | |
| Independence | Gregory Mikkelson | 14,903 | 4.5 | - | |
| Party | Candidate | Votes | % | ±% | |
|---|---|---|---|---|---|
| Democratic (DFL) | Tim Walz (Incumbent) | 122,390 | 49.4 | -13.1 | |
| Republican | Randy Demmer | 109,261 | 44.1 | +11.2 | |
| Independence | Steven Wilson | 13,243 | 5.3 | +0.8 | |
| Party | Candidate | Votes | % | ±% | |
|---|---|---|---|---|---|
| Democratic (DFL) | Tim Walz (Incumbent) | 193,211 | 57.5 | +8.1 | |
| Republican | Allen Quist | 142,164 | 42.3 | -1.8 | |
| Party | Candidate | Votes | % | ±% | |
|---|---|---|---|---|---|
| Democratic (DFL) | Tim Walz (Incumbent) | 122,851 | 54.2 | -3.3 | |
| Republican | Jim Hagedorn | 103,536 | 45.7 | +3.4 | |
| Party | Candidate | Votes | % | ±% | |
|---|---|---|---|---|---|
| Democratic (DFL) | Tim Walz (Incumbent) | 169,076 | 50.4 | -3.8 | |
| Republican | Jim Hagedorn | 166,527 | 49.6 | +3.9 | |
| Party | Candidate | Votes | % | ±% | |
|---|---|---|---|---|---|
| Republican | Jim Hagedorn | 146,202 | 50.1 | +0.5 | |
| Democratic (DFL) | Dan Feehan | 144,891 | 49.7 | -0.7 | |
| Party | Candidate | Votes | % | |
|---|---|---|---|---|
| Republican | Jim Hagedorn (incumbent) | 179,234 | 48.6 | |
| Democratic (DFL) | Dan Feehan | 167,890 | 45.5 | |
| Grassroots | Bill Rood | 21,448 | 5.8 | |
| Write-in | 284 | 0.1 | ||
| Total votes | 368,856 | 100.0 | ||
| Republican hold | ||||
Election results from statewide races
| Year | Office | Results |
|---|---|---|
| 2000 | President | George W. Bush 49 - Al Gore 45% |
| 2004 | President | George W. Bush 51 - John Kerry 47% |
| 2008 | President | Barack Obama 51 - John McCain 47% |
| 2012 | President | Barack Obama 49.6 - Mitt Romney 48.2% |
| Senate | Amy Klobuchar 62 - Kurt Bills 32% | |
| 2014 | Governor | Jeff Johnson 48 - Mark Dayton 46% |
| Attorney General | Lori Swanson 48 - Scott Newman 43% | |
| Secretary of State | Dan Severson 50 - Steve Simon 42% | |
| State Auditor | Rebecca Otto 45 - Randy Gilbert 45% | |
| 2016 | President | Donald J. Trump 53.3 - Hillary Clinton 38.4% |
| 2018 | Governor | Tim Walz 50 - Jeff Johnson 47% |
| Attorney General | Doug Wardlow 52 - Keith Ellison 42% | |
| Senate | Amy Klobuchar 53.5 - Jim Newberger 42.0% | |
| Secretary of State | John Howe 50 - Steve Simon 45% | |
| State Auditor | Pam Myhra 50 - Julie Blaha 43% | |
| 2020 | President | Donald J. Trump 53.8 - Joe Biden 43.7% |
Historical district boundaries

References
- "Minnesota congressional districts by urban and rural population and land area" (PDF). US Census Bureau. 2000. Retrieved 2007-04-02.
- Geography, US Census Bureau. "Congressional Districts Relationship Files (state-based)". www.census.gov.
 This article incorporates public domain material from this U.S government document.
 - Bureau, Center for New Media & Promotion (CNMP), US Census. "My Congressional District". www.census.gov.
- https://www.census.gov/mycd/?st=27&cd=01
- https://censusreporter.org/profiles/50000US2701-congressional-district-1-mn/
- "Partisan Voting Index – Districts of the 115th Congress" (PDF). The Cook Political Report. April 7, 2017. Retrieved April 7, 2017.
- "Results for All Congressional Districts". Minnesota Secretary of State. Retrieved November 25, 2020.

.jpg.webp)


