List of countries by life expectancy
The article documents lists of countries by average life expectancy at birth by various sources of estimates.
Methodology
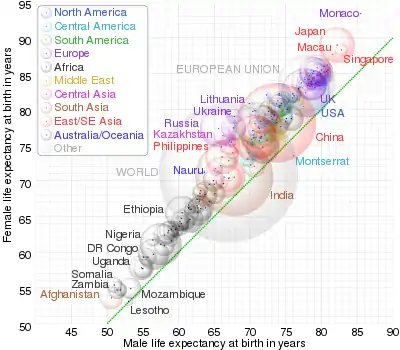
The life expectancy is shown separately for males, and for females, as well as a combined figure. Several non-sovereign entities are also included in this list.
The figures reflect the quality of healthcare in the countries listed as well as other factors including ongoing wars, obesity, and HIV infections.
Worldwide, the average life expectancy at birth was 71 years (70 years for males and 72 years for females) over the period 2010–2015 according to United Nations World Population Prospects 2015 Revision,[1] or 69 years (67 years for males and 71.1 years for females) for 2016 according to The World Factbook.[2] According to the 2015 World Health Organization (WHO) data, women on average live longer than men in all major regions and in all individual countries.
The countries with the lowest overall life expectancies per the WHO are Sierra Leone, the Central African Republic, the Democratic Republic of the Congo, Guinea-Bissau, Lesotho, Somalia, Eswatini, Angola, Chad, Mali, Burundi, Cameroon, and Mozambique. Of those countries, only Lesotho, Eswatini, and Mozambique in 2011 were suffering from an HIV prevalence rate of greater than 12 percent in the 15–49 age group.[3]
Comparing life expectancies from birth across countries can be problematic. There are differing definitions of live birth vs stillbirth even among more developed countries and less developed countries often have poor reporting.[4]
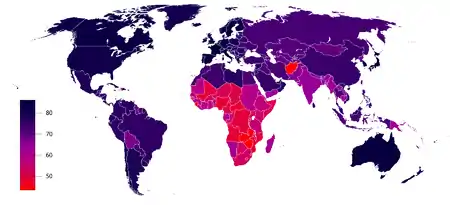
UNDP (2019)
.svg.png.webp)
|
> 82.4
80.0 – 82.4
77.5 – 79.9
75.0 – 77.4
72.5 – 74.9
70.0 – 72.4
67.5 – 69.9 |
65.0 – 67.4
62.5 – 64.9
60.0 – 62.4
55.0 – 59.9
< 55.0
No data |
| Rank | Countries and regions | Life expectancy at birth (in years) | |||
|---|---|---|---|---|---|
| Overall | Female | Male | Difference (years) | ||
| 1 | 84.9 | 87.7 | 82.0 | 5.7 | |
| 2 | 84.6 | 87.7 | 81.5 | 6.2 | |
| 3 | 83.8 | 85.6 | 81.9 | 3.7 | |
| 4 | 83.6 | 85.7 | 81.5 | 4.2 | |
| 5 | 83.6 | 86.2 | 80.8 | 5.4 | |
| 6 | 83.5 | 85.5 | 81.3 | 4.2 | |
| 7 | 83.4 | 85.4 | 81.5 | 3.9 | |
| 8 | 83.0 | 84.5 | 81.5 | 3.0 | |
| 9 | 83.0 | 84.5 | 81.3 | 3.2 | |
| 10 | 83.0 | 86.0 | 79.9 | 6.1 | |
| 11 | 82.8 | 84.6 | 81.0 | 3.6 | |
| 12 | 82.7 | 85.5 | 79.7 | 5.8 | |
| 13 | 82.5 | 84.3 | 80.7 | 3.6 | |
| 14 | 82.4 | 84.4 | 80.4 | 4 | |
| 15 | 82.4 | 84.4 | 80.4 | 4 | |
| 16 | 82.3 | 83.9 | 80.7 | 3.3 | |
| 17 | 82.3 | 84.0 | 80.6 | 3.4 | |
| 18 | 82.3 | 84.0 | 80.6 | 3.5 | |
| 19 | 82.3 | 84.3 | 80.2 | 4.2 | |
| 20 | 82.2 | 84.7 | 79.8 | 4.9 | |
| 21 | 82.1 | 84.9 | 79.0 | 5.9 | |
| 22 | 81.9 | 84.7 | 79.1 | 5.7 | |
| 23 | 81.9 | ||||
| 24 | 81.6 | 83.9 | 79.3 | 4.7 | |
| 25 | 81.5 | 83.9 | 79.2 | 4.8 | |
| 26 | 81.3 | 83.7 | 78.9 | 4.8 | |
| 27 | 81.3 | 83.0 | 79.6 | 3.5 | |
| 28 | 81.3 | 84.0 | 78.6 | 5.5 | |
| 29 | 81.0 | 83.0 | 78.9 | 4.2 | |
| 30 | 80.9 | 82.9 | 78.9 | 5 | |
| 31 | 80.7 | ||||
| 32 | 80.3 | 82.9 | 77.7 | 5.2 | |
| 33 | 80.2 | 82.4 | 77.8 | 4.8 | |
| 34 | 80.2 | 82.0 | 79.1 | 4.8 | |
| 35 | 79.4 | 81.9 | 76.8 | 5.2 | |
| 36 | 79.2 | 80.5 | 77.8 | 2.7 | |
| 37 | 78.9 | 81.4 | 76.3 | 5.1 | |
| 38 | 78.9 | 80.9 | 77.1 | 3.7 | |
| 39 | 78.9 | 80.8 | 77.5 | 3.7 | |
| 40 | 78.8 | 82.7 | 74.4 | 8.4 | |
| 41 | 78.8 | 80.8 | 76.8 | 3.9 | |
| 42 | 78.7 | 82.6 | 74.8 | 7.8 | |
| 43 | 78.6 | 80.2 | 77.0 | 7.8 | |
| 44 | 78.5 | 81.6 | 75.3 | 6.4 | |
| 45 | 78.5 | 81.8 | 75.4 | 6.4 | |
| 46 | 78.2 | ||||
| 47 | 78.0 | 79.3 | 77.3 | 2.1 | |
| 48 | 77.9 | 81.5 | 74.1 | 7.4 | |
| 49 | 77.9 | 80.3 | 76.1 | 4.2 | |
| 50 | 77.7 | 80.6 | 74.7 | 5.4 | |
| 51 | 77.5 | 81.0 | 74.0 | 7 | |
| 52 | 77.4 | 79.9 | 74.9 | 4.9 | |
| 53 | 77.3 | 78.4 | 76.4 | 2 | |
| 54 | 77.3 | 80.0 | 74.5 | 5.6 | |
| 55 | 77.2 | 80.9 | 73.5 | 7.5 | |
| 56 | 77.0 | 80.3 | 73.6 | 6.7 | |
| 57 | 77.0 | 78.1 | 75.9 | 2.3 | |
| 58 | 77.0 | 79.8 | 74.3 | 5.5 | |
| 59 | 76.9 | 80.3 | 73.2 | 7 | |
| 60 | 76.9 | 79.3 | 74.4 | 4.9 | |
| 61 | 76.9 | 79.2 | 74.8 | 4.6 | |
| 62 | 76.9 | 78.1 | 75.7 | 2.4 | |
| 63 | 76.7 | 80.0 | 73.2 | 6.8 | |
| 64 | 76.7 | 77.9 | 75.6 | 2.3 | |
| 65 | 76.7 | 79.5 | 74.1 | 5.5 | |
| 66 | 76.7 | 78.7 | 74.7 | 4 | |
| 67 | 76.7 | 77.9 | 75.4 | 2.5 | |
| 68 | 76.2 | 78.3 | 74.2 | 4.1 | |
| 69 | 76.2 | 77.6 | 74.9 | 2.7 | |
| 70 | 76.1 | 79.5 | 72.6 | 6.9 | |
| 71 | 76.0 | 78.6 | 73.4 | 5.2 | |
| 72 | 75.9 | 81.4 | 70.3 | 11.1 | |
| 73 | 75.9 | 77.1 | 74.7 | 2.4 | |
| 74 | 75.9 | 79.4 | 72.2 | 7.4 | |
| 75 | 75.8 | 77.8 | 73.8 | 4 | |
| — | Latin America and the Caribbean | 75.6 | 78.7 | 72.4 | 6.3 |
| 76 | 75.5 | 76.6 | 74.8 | 1.8 | |
| — | East Asia and the Pacific | 75.4 | 78.0 | 73.1 | 4.9 |
| 77 | 75.4 | 79.5 | 71.3 | 8.2 | |
| 78 | 75.3 | 80.0 | 70.2 | 9.8 | |
| 79 | 75.3 | 77.6 | 73.0 | 4.6 | |
| 80 | 75.1 | 76.8 | 73.9 | 2.8 | |
| 81 | 75.1 | 78.7 | 71.5 | 7.1 | |
| 82 | 75.1 | 77.9 | 72.2 | 5.7 | |
| 83 | 75.1 | 78.5 | 71.3 | 7.2 | |
| 84 | 75.0 | 78.5 | 71.7 | 6.9 | |
| 85 | 74.8 | 79.6 | 69.7 | 10 | |
| 86 | 74.8 | ||||
| 87 | 74.6 | 77.8 | 71.7 | 6.1 | |
| 88 | 74.5 | 76.1 | 72.9 | 3.2 | |
| 89 | 74.5 | 76.3 | 72.8 | 3.5 | |
| 90 | 74.5 | 78.0 | 70.9 | 7.1 | |
| — | Europe and Central Asia | 74.4 | 77.7 | 71.1 | 6.7 |
| 91 | 74.3 | 76.4 | 72.3 | 4.1 | |
| 92 | 74.3 | 77.2 | 72.2 | 4.1 | |
| 93 | 74.1 | 77.4 | 71.0 | 6.4 | |
| 94 | 74.1 | 75.8 | 72.4 | 3.3 | |
| 95 | 74.1 | ||||
| 96 | 73.9 | ||||
| 97 | 73.9 | 76.1 | 71.7 | 4.4 | |
| 98 | 73.8 | 78.1 | 69.3 | 8.8 | |
| 99 | 73.5 | 77.7 | 69.2 | 5.3 | |
| 100 | 73.6 | 76.2 | 70.9 | 8.5 | |
| 101 | 73.4 | 77.4 | 69.9 | 7.5 | |
| 102 | 73.3 | 75.5 | 71.3 | 4.1 | |
| 103 | 73.3 | 77.8 | 68.5 | 9.4 | |
| 104 | 73.0 | 75.5 | 70.5 | 5 | |
| 105 | 73.0 | 76.2 | 69.5 | 6.7 | |
| 106 | 73.0 | 74.9 | 71.3 | 3.5 | |
| 107 | 72.9 | 76.0 | 70.1 | 5.9 | |
| — | World | 72.8 | 75.0 | 70.6 | 4.5 |
| 108 | 72.7 | 78.1 | 67.9 | 11.2 | |
| 109 | 72.6 | 77.8 | 67.1 | 10.7 | |
| 110 | 72.6 | 74.6 | 70.9 | 3.7 | |
| 111 | 72.5 | 75.1 | 70.3 | 4.8 | |
| 112 | 72.4 | 75.0 | 70.1 | 4.8 | |
| 113 | 72.1 | 76.8 | 67.1 | 9.7 | |
| — | Arab States | 72.1 | 73.9 | 70.4 | 3.6 |
| 114 | 72.1 | 76.0 | 68.3 | 7.7 | |
| 115 | 72.0 | 74.3 | 69.7 | 4.6 | |
| 116 | 71.9 | 76.2 | 67.6 | 8.6 | |
| 117 | 71.7 | 72.2 | 71.4 | 6.5 | |
| 118 | 71.8 | 75.1 | 68.5 | 0.7 | |
| 119 | 71.7 | 73.8 | 69.6 | 4.3 | |
| 120 | 71.7 | 74.0 | 69.6 | 4.3 | |
| 121 | 71.5 | 74.5 | 68.7 | 5.8 | |
| 122 | 71.5 | 75.6 | 67.4 | 8.2 | |
| 123 | 71.2 | 75.5 | 67.3 | 8.3 | |
| 124 | 71.1 | 73.4 | 68.9 | 4.5 | |
| 125 | 70.9 | 72.9 | 69.0 | 3.9 | |
| 126 | 70.8 | 72.2 | 69.3 | 2.9 | |
| 127 | 70.6 | 72.7 | 68.6 | 4.1 | |
| 128 | 70.5 | 72.2 | 69.0 | 3.2 | |
| 129 | 70.4 | 72.8 | 68.0 | 4.8 | |
| 130 | 69.9 | 74.1 | 65.8 | 8.4 | |
| — | South Asia | 69.9 | 71.3 | 68.7 | 2.6 |
| 131 | 69.9 | 73.1 | 66.9 | 6.2 | |
| 132 | 69.8 | 71.9 | 67.5 | 4.3 | |
| 133 | 69.7 | 71.0 | 68.5 | 2.5 | |
| 134 | 69.6 | 72.4 | 66.5 | 5.8 | |
| 135 | 69.5 | 71.6 | 67.5 | 4.1 | |
| 136 | 69.0 | 71.1 | 66.8 | 4.3 | |
| 137 | 68.4 | 72.3 | 64.2 | 8 | |
| 138 | 68.2 | 71.7 | 64.7 | 7 | |
| 139 | 67.9 | 69.6 | 66.2 | 3.4 | |
| 140 | 67.9 | 69.7 | 66.1 | 3.6 | |
| 141 | 67.9 | 69.9 | 65.8 | 4.1 | |
| 142 | 67.4 | 69.3 | 65.7 | 3.6 | |
| 143 | 67.3 | 68.3 | 66.3 | 1.9 | |
| 144 | 67.1 | 70.1 | 64.0 | 6.1 | |
| 145 | 67.1 | 69.4 | 65.1 | 4.2 | |
| 146 | 67.0 | 68.7 | 65.4 | 3.2 | |
| 147 | 66.7 | 69.0 | 64.3 | 4.7 | |
| 148 | 66.6 | 68.5 | 64.7 | 3.8 | |
| 149 | 66.5 | 68.7 | 64.4 | 4.7 | |
| 150 | 66.3 | 68.6 | 64.2 | 4.4 | |
| 151 | 66.1 | 67.8 | 64.4 | 3.4 | |
| 152 | 65.5 | 67.2 | 63.6 | 3.6 | |
| 153 | 65.3 | 67.2 | 63.5 | 3.6 | |
| 154 | 64.9 | 66.5 | 63.3 | 3.2 | |
| 155 | 64.8 | 66.4 | 63.4 | 3 | |
| 156 | 64.6 | 66.0 | 63.1 | 2.9 | |
| 157 | 64.5 | 65.8 | 63.3 | 2.6 | |
| 158 | 64.3 | 66.1 | 62.6 | 3.5 | |
| 159 | 64.3 | 67.4 | 61.1 | 6.2 | |
| 160 | 64.1 | 67.7 | 60.7 | 6.9 | |
| 161 | 64.1 | 65.2 | 63.0 | 2.2 | |
| 162 | 64.1 | 65.5 | 62.7 | 2.8 | |
| 163 | 64.0 | 66.2 | 61.8 | 4.3 | |
| 164 | 63.9 | 66.9 | 60.8 | 5.9 | |
| 165 | 63.7 | 66.5 | 60.7 | 5.8 | |
| 166 | 63.4 | 65.6 | 61.0 | 4.5 | |
| 167 | 62.4 | 63.6 | 61.3 | 2.3 | |
| 168 | 62.1 | 63.5 | 60.7 | 2.8 | |
| 169 | 61.8 | 63.3 | 60.2 | 3.1 | |
| 170 | 61.6 | 62.1 | 60.9 | 1.2 | |
| 171 | 61.6 | 62.3 | 60.7 | 1.5 | |
| 172 | 61.6 | 63.4 | 59.8 | 3.6 | |
| — | Sub-Saharan Africa | 61.5 | 63.3 | 59.8 | 3.1 |
| 173 | 61.5 | 62.9 | 59.8 | 3.1 | |
| 174 | 61.2 | 64.0 | 58.4 | 5.6 | |
| 175 | 61.0 | 61.9 | 60.2 | 1.7 | |
| 176 | 60.9 | 63.7 | 57.8 | 5.9 | |
| 177 | 60.7 | 62.2 | 59.1 | 3 | |
| 178 | 60.2 | 64.8 | 56.0 | 8.7 | |
| 179 | 59.3 | 60.6 | 58.0 | 2.5 | |
| 180 | 59.3 | 60.1 | 58.5 | 1.5 | |
| 181 | 58.7 | 59.9 | 57.7 | 2.2 | |
| 182 | 58.3 | 60.2 | 56.3 | 3.9 | |
| 183 | 57.9 | 59.4 | 56.4 | 3 | |
| 184 | 57.8 | 59.1 | 56.6 | 2.4 | |
| 185 | 54.7 | 55.6 | 53.8 | 1.7 | |
| 186 | 54.7 | 55.5 | 53.9 | 1.6 | |
| 187 | 54.3 | 57.6 | 51.2 | 6.4 | |
| 188 | 54.2 | 55.7 | 52.8 | 2.8 | |
| 189 | 53.3 | 55.5 | 51.1 | 4.4 | |
List by the World Health Organization (2015)
.png.webp)
|
|
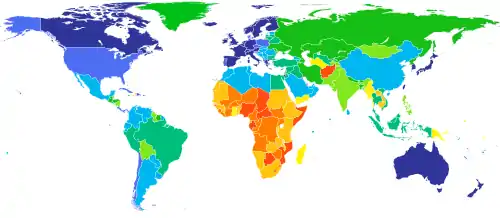
List by the United Nations, for 2010–2015
In July 2015, the Population Division of the United Nations Department of Economic and Social Affairs (UN DESA), released World Population Prospects, The 2015 Revision.[1] The following table shows the life expectancy at birth for the period 2010 to 2015.


|
Over 80
77.5–80.0
75.0–77.5
72.5–75.0
70.0–72.5
67.5–70.0
65.0–67.5 |
60–65
55–60
50–55
45–50
Under 45
not available |
|
|
List from the GBD 2010 study
The Global Burden of Disease 2010 study published updated figures in 2012,[11] including recalculations of life expectancies[12] which differ substantially in places from the UN estimates for 2010 (reasons for this are discussed in the freely available appendix to the paper, pages 25–27, currently not available). Although no estimate is given for the sexes combined, for the first time life expectancy estimates have included uncertainty intervals.
|
|
List by the CIA (2017)
|
> 80
> 77.5 |
> 75
> 72.5 |
> 70
> 67.5 |
> 65
> 60 |
> 55
> 50 |
The US CIA published the following life expectancy data in its World Factbook.[13]
|
|
List by the OECD (2016)
|
|
Notes
See also
- List of countries by past life expectancy
- List of countries by hospital beds
- List of countries by intentional death rate
- List of countries by intentional homicide rate
- List of countries by suicide rate
- List of U.S. counties with shortest life expectancy
- List of U.S. states by life expectancy
- List of federal subjects of Russia by life expectancy
- List of European regions by life expectancy
- List of countries by total health expenditure per capita
References
- United Nations Department of Economic and Social Affairs (29 July 2015). "United Nations World Population Prospects: 2015 revision" (PDF). UN.
- "The World Fact-book Life Expectancy". Cia.gov. 2012.
- "Countries". www.unaids.org.
- "WHO - Long-term trends in fetal mortality: implications for developing countries". www.who.int.
- "Human Development Report 2019" (PDF). United Nations Development Programme. 10 December 2019. Retrieved 12 December 2019.
- http://hdr.undp.org/sites/default/files/hdr2019.pdf
- "Human Development Report 2019" (PDF). United Nations Development Programme.
- "World Health Statistics 2016: Monitoring health for the SDGs Annex B: tables of health statistics by country, WHO region and globally". World Health Organization. 2016. Retrieved 27 June 2016.
- "Life expectancy increased by 5 years since 2000, but health inequalities persist". WHO. 19 May 2016.
- A = years lived healthily
B = years lived with disability
A + B = life expectancy
A + fB = healthy life expectancy, where f is a weighting to reflect disability level. - Das, Pamela; Samarasekera, Udani (2012). "The story of GBD 2010: a "super-human" effort". The Lancet. 380 (9859): 2067–2070. doi:10.1016/S0140-6736(12)62174-6. PMID 23259158.
- Wang, Haidong; Dwyer-Lindgren, Laura; Lofgren, Katherine T; Rajaratnam, Julie Knoll; Marcus, Jacob R; Levin-Rector, Alison; Levitz, Carly E; Lopez, Alan D; Murray, Christopher JL (2012). "Age-specific and sex-specific mortality in 187 countries, 1970–2010: a systematic analysis for the Global Burden of Disease Study 2010". The Lancet. 380 (9859): 2071–2094. doi:10.1016/S0140-6736(12)61719-X. PMID 23245603.
- "The World Factbook — Central Intelligence Agency". www.cia.gov.
- "Health status - Life expectancy at birth - OECD Data". theOECD.
- "Data for Canada is for 2012, see" (PDF).
External links
- Global Agewatch has the latest internationally comparable statistics on life expectancy from 195 countries.
- Life expectancy trends interactive graph
- Life expectancy interactive world map
- Global Life Expectancy (Infographic)|LiveScience
- U.S. States life expectancy compared to the world (Infographic & Study)|Simply Insurance