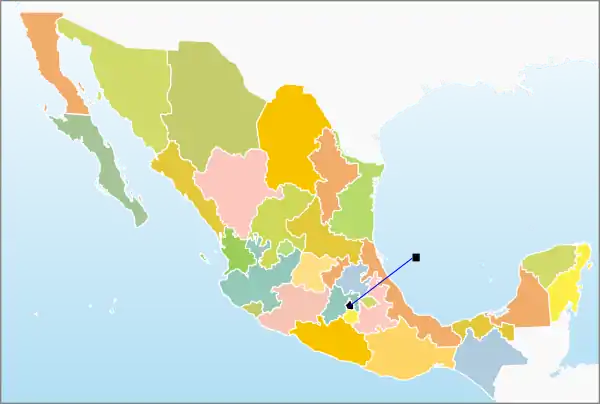
List of Mexican states by GDP
The following is the list of the GDP (Nominal) of Mexico's 32 federal states, ranked in order of their GDP (Nominal) as of 2011.

Gulf of
Mexico
Mexico
Pacific
Ocean
Ocean
Central
America
America
United States of America
Mexican states

GDP per capita of Mexican states, US$, 2007.
| Mexican States by GDP - 2014[1] | |||||
|---|---|---|---|---|---|
| Rank | State | GDP (millions of MXN) | GDP (millions of USD) | Percent | |
| - | 13,401,295 | 1,008,206 | 100% | ||
| 1 | 2,254,840 | 169,636 | 17% | ||
| 2 | 1,209,424 | 90,987 | 9% | ||
| 3 | 999,407 | 75,187 | 7% | ||
| 4 | 850,237 | 63,965 | 6% | ||
| 5 | 610,623 | 45,938 | 5% | ||
| 6 | 675,465 | 50,817 | 5% | ||
| 7 | 434,948 | 32,722 | 3% | ||
| 8 | 557,382 | 41,933 | 4% | ||
| 9 | 424,856 | 31,963 | 3% | ||
| 10 | 454,047 | 34,159 | 3% | ||
| 11 | 413,971 | 31,144 | 3% | ||
| 12 | 382,604 | 28,784 | 3% | ||
| 13 | 397,033 | 29,870 | 3% | ||
| 14 | 382,383 | 28,767 | 3% | ||
| 15 | 318,308 | 23,947 | 2% | ||
| 16 | 292,723 | 22,022 | 2% | ||
| 17 | 276,520 | 20,803 | 2% | ||
| 18 | 257,972 | 19,408 | 2% | ||
| 19 | 234,618 | 17,651 | 2% | ||
| 20 | 216,423 | 16,282 | 2% | ||
| 21 | 213,670 | 16,075 | 2% | ||
| 22 | 208,967 | 15,721 | 2% | ||
| 23 | 196,501 | 14,783 | 1% | ||
| 24 | 195,471 | 14,706 | 1% | ||
| 25 | 158,956 | 11,959 | 1% | ||
| 26 | 163,567 | 12,305 | 1% | ||
| 27 | 155,936 | 11,731 | 1% | ||
| 28 | 126,156 | 9,491 | 1% | ||
| 29 | 87,956 | 6,617 | 1% | ||
| 30 | 79,809 | 6,004 | 1% | ||
| 31 | 97,833 | 7,360 | 1% | ||
| 32 | 72,689 | 5,469 | 1% | ||
See also
General:
This article is issued from Wikipedia. The text is licensed under Creative Commons - Attribution - Sharealike. Additional terms may apply for the media files.