Alabama's 2nd congressional district
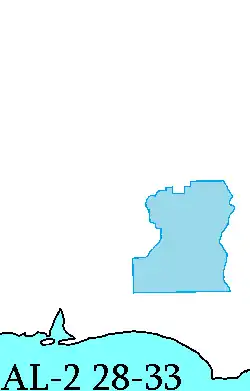
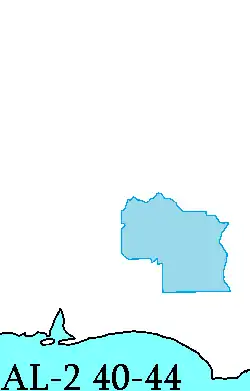
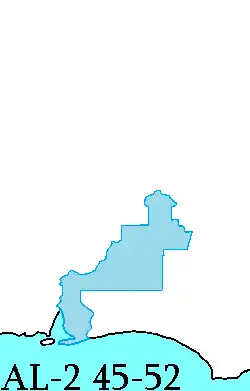
Alabama's 2nd congressional district is a United States congressional district in Alabama that elected a representative to the United States House of Representatives. It includes most of the Montgomery metropolitan area, and stretches into the Wiregrass Region in the southeastern portion of the state. The district encompasses portions of Montgomery County and the entirety of Autauga, Barbour, Bullock, Butler, Coffee, Conecuh, Covington, Crenshaw, Dale, Elmore, Geneva, Henry, Houston and Pike counties. Other cities in the district include Andalusia, Dothan, Greenville, and Troy.
| Alabama's 2nd congressional district | |||
|---|---|---|---|
.tif.png.webp) Alabama's 2nd congressional district - since January 3, 2013. | |||
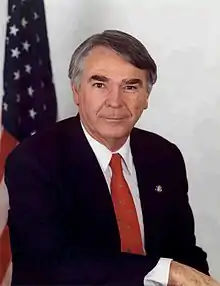
| Representative |
| ||
| Area | 10,608 sq mi (27,470 km2) | ||
| Distribution |
| ||
| Population (2019) | 674,920[2] | ||
| Median household income | $50,494[3] | ||
| Ethnicity |
| ||
| Occupation |
| ||
| Cook PVI | R+16[4] | ||
The district is represented by Republican Barry Moore, a former Alabama state representative, who replaced Martha Roby, the retired Republican incumbent, in the 2020 election.
Character
There are several small-to-medium-sized cities spread throughout the district. Fort Rucker and Maxwell-Gunter Air Force Base are both within its bounds, as is Troy University.
White voters here were among the first in Alabama to shift from the Democratic Party; the old-line Southern Democrats in this area began splitting their tickets as early as the 1950s. Today, the district is one of the most Republican districts in both Alabama and the nation. It has only supported a Democrat for president once since 1956, when Jimmy Carter carried it in 1976. In 2008, the district elected a Democrat to Congress for the first time since 1964, but it reverted to its Republican ways in 2010. At the state and local level, however, conservative Democrats continued to hold most offices as late as 2002.
White voters gave John McCain, the Republican candidate, 63.42% of the vote in 2008; Barack Obama, the Democratic candidate, received 36.05%, attracting voters beyond the substantial (and expected) African-American minority.
The district gives its congressmen very long tenures in Washington; only seven people have represented it since 1923.
Recent election results from statewide races
| Year | Office | Results |
|---|---|---|
| 2000 | President | Bush 61 - 38% |
| 2004 | President | Bush 67 - 33% |
| 2008 | President | McCain 63 - 36% |
| 2012 | President | Romney 63 - 36% |
| 2016 | President | Trump 65 - 33% |
List of members representing the district
Recent election results
2006
| Party | Candidate | Votes | % | |
|---|---|---|---|---|
| Republican | Terry Everett (incumbent) | 124,302 | 69.47% | |
| Democratic | Chuck James | 54,450 | 30.43% | |
| Write-in | 167 | 0.09% | ||
| Total votes | 178,919 | 100% | ||
| Republican hold | ||||
2008
| Party | Candidate | Votes | % | |||
|---|---|---|---|---|---|---|
| Democratic | Bobby Bright | 144,368 | 50.23% | |||
| Republican | Jay Love | 142,578 | 49.61% | |||
| Write-in | 448 | 0.16% | ||||
| Total votes | 287,394 | 100% | ||||
| Democratic gain from Republican | ||||||
2010
| Party | Candidate | Votes | % | |||
|---|---|---|---|---|---|---|
| Republican | Martha Roby | 111,332 | 51.12% | |||
| Democratic | Bobby Bright (incumbent) | 106,465 | 48.88% | |||
| Total votes | 217,797 | 100% | ||||
| Republican gain from Democratic | ||||||
2012
| Party | Candidate | Votes | % | |
|---|---|---|---|---|
| Republican | Martha Roby (incumbent) | 180,591 | 63.60% | |
| Democratic | Therese Ford | 103,092 | 36.31% | |
| Write-in | 270 | 0.10% | ||
| Total votes | 283,953 | 100% | ||
| Republican hold | ||||
2014
| Party | Candidate | Votes | % | |
|---|---|---|---|---|
| Republican | Martha Roby (incumbent) | 113,103 | 67.34% | |
| Democratic | Erick Wright | 54,692 | 32.56% | |
| Write-in | 157 | 0.09% | ||
| Total votes | 167,952 | 100% | ||
| Republican hold | ||||
2016
| Party | Candidate | Votes | % | |
|---|---|---|---|---|
| Republican | Martha Roby (incumbent) | 134,886 | 48.77% | |
| Democratic | Nathan Mathis | 112,089 | 40.53% | |
| Write-in | 29,609 | 10.71% | ||
| Total votes | 276,584 | 100% | ||
| Republican hold | ||||
2018
| Party | Candidate | Votes | % | |
|---|---|---|---|---|
| Republican | Martha Roby (incumbent) | 138,879 | 61.39% | |
| Democratic | Tabitha Isner | 86,931 | 38.43% | |
| Write-in | 420 | 0.19% | ||
| Total votes | 226,230 | 100% | ||
| Republican hold | ||||
2020
| Party | Candidate | Votes | % | |
|---|---|---|---|---|
| Republican | Barry Moore | 197,996 | 65.2% | |
| Democratic | Phyllis Harvey-Hall | 105,286 | 34.7% | |
| Write-in | 287 | 0.1% | ||
| Total votes | 303,569 | 100% | ||
| Republican hold | ||||
References
- Specific
- http://proximityone.com/cd113_2010_ur.htm
- https://www.census.gov/mycd/?st=01&cd=02
- https://www.census.gov/mycd/?st=01&cd=02
- "Partisan Voting Index – Districts of the 115th Congress" (PDF). The Cook Political Report. April 7, 2017. Retrieved April 7, 2017.
- General
- Martis, Kenneth C. (1989). The Historical Atlas of Political Parties in the United States Congress. New York: Macmillan Publishing Company.
- Martis, Kenneth C. (1982). The Historical Atlas of United States Congressional Districts. New York: Macmillan Publishing Company.
- Congressional Biographical Directory of the United States 1774–present
- A New Nation Votes
- "AL - District 02 - History". www.ourcampaigns.com. Retrieved 2020-09-22.







.jpg.webp)




.tif.png.webp)
