2017 Pembrokeshire County Council election
An election to Pembrokeshire County Council will be held on 4 May 2017 as part of wider local elections across Wales. The election was preceded by the 2012 election.[1] Twelve seats (out of the sixty available) had candidates elected unopposed.
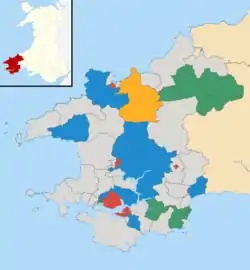
Ward results
Nominations closed on 4 April 2017.[2]
Amroth
| Party | Candidate | Votes | % | ±% | |
|---|---|---|---|---|---|
| Conservative | Tony Barron | 225 | 50.2 | ||
| Liberal Democrats | Mary Kathleen Megarry | 223 | 49.8 | ||
| Majority | 2 | 0.4 | |||
| Conservative gain from Independent | Swing | ||||
Burton
Rob Summons was elected as an Independent at a by-election in 2013.
| Party | Candidate | Votes | % | ±% | |
|---|---|---|---|---|---|
| Conservative | Robert George Summons* | Unopposed | |||
| Conservative gain from Independent | |||||
Camrose
| Party | Candidate | Votes | % | ±% | |
|---|---|---|---|---|---|
| Independent | James Llewellyn Adams* | 448 | |||
| Independent | Nicky Watts | 358 | |||
| Conservative | Jonathan David Twigg | 275 | |||
| Plaid Cymru | Kay Dearing | 135 | |||
| Majority | 90 | ||||
| Independent hold | Swing | ||||
Carew
| Party | Candidate | Votes | % | ±% | |
|---|---|---|---|---|---|
| Plaid Cymru | Paul David Rapi | 310 | |||
| Independent | David James Neale* | 224 | |||
| Independent | Norman Richard Parry | 59 | |||
| Majority | 86 | ||||
| Plaid Cymru gain from Independent | Swing | ||||
Cilgerran
| Party | Candidate | Votes | % | ±% | |
|---|---|---|---|---|---|
| Independent | John Thomas Davies* | Unopposed | |||
| Independent hold | |||||
Clydau
| Party | Candidate | Votes | % | ±% | |
|---|---|---|---|---|---|
| Plaid Cymru | Roderick Gwilym Bowen* | Unopposed | |||
| Plaid Cymru hold | |||||
Crymych
| Party | Candidate | Votes | % | ±% | |
|---|---|---|---|---|---|
| Plaid Cymru | Cristoffer Wyn Tomos | 616 | |||
| Independent | John Keith Lewis* | 516 | |||
| Majority | 100 | ||||
| Plaid Cymru gain from Independent | Swing | ||||
Dinas Cross
| Party | Candidate | Votes | % | ±% | |
|---|---|---|---|---|---|
| Liberal Democrats | Bob Kilmister* | 550 | |||
| Plaid Cymru | Myles Anthony Bamford-Lewis | 154 | |||
| Majority | 396 | ||||
| Liberal Democrats hold | Swing | ||||
East Williamston
| Party | Candidate | Votes | % | ±% | |
|---|---|---|---|---|---|
| Independent | Jacob John Williams* | 730 | |||
| Independent | Mackie Harts | 242 | |||
| Majority | 488 | ||||
| Independent hold | Swing | ||||
Fishguard North East
| Party | Candidate | Votes | % | ±% | |
|---|---|---|---|---|---|
| Independent | Myles Christopher Geary Pepper* | 449 | |||
| Labour | Alexander Frederick Allison | 286 | |||
| Majority | 163 | ||||
| Independent hold | Swing | ||||
Fishguard North West
Pat Davies was elected as a Labour candidate in 2012
| Party | Candidate | Votes | % | ±% | |
|---|---|---|---|---|---|
| Independent | Pat Davies* | 371 | |||
| Plaid Cymru | Dennis Morris | 122 | |||
| Conservative | James Jonathon Thickitt | 58 | |||
| Majority | 249 | ||||
| Independent hold | Swing | ||||
Goodwick
| Party | Candidate | Votes | % | ±% | |
|---|---|---|---|---|---|
| Independent | Kevin William Doolin | 262 | |||
| Labour | Gwilym Patrick Price* | 234 | |||
| Liberal Democrats | Richard John Grosvenor | 122 | |||
| Majority | 28 | ||||
| Independent gain from Labour | Swing | ||||
Haverfordwest: Castle
| Party | Candidate | Votes | % | ±% | |
|---|---|---|---|---|---|
| Labour | Thomas Baden Tudor* | 483 | |||
| Independent | Sally Williams | 190 | |||
| Conservative | Kevin Lewis Davies | 155 | |||
| Majority | 328 | ||||
| Labour hold | Swing | ||||
Haverfordwest Garth
| Party | Candidate | Votes | % | ±% | |
|---|---|---|---|---|---|
| Independent | Lyndon Leslie Frayling* | 229 | |||
| Independent | Sue Murray | 145 | |||
| Conservative | Chris Evans-Thomas | 100 | |||
| Majority | 84 | ||||
| Independent hold | Swing | ||||
Haverfordwest Portfield
| Party | Candidate | Votes | % | ±% | |
|---|---|---|---|---|---|
| Independent | Tim Evans | 436 | |||
| Labour | Anthony William Griffiths | 199 | |||
| Conservative | Martin Paul David Lewis | 172 | |||
| Majority | 237 | ||||
| Independent hold | Swing | ||||
Haverfordwest Prendergast
| Party | Candidate | Votes | % | ±% | |
|---|---|---|---|---|---|
| Labour | Alison Mary Tudor | 356 | |||
| Conservative | Thomas Peter Lewis | 164 | |||
| Independent | Chris Lee Harries | 109 | |||
| Independent | Gitti Coats | 107 | |||
| Majority | 192 | ||||
| Labour gain from Independent | Swing | ||||
Haverfordwest Priory
The sitting member was elected as an Independent in 2012.
| Party | Candidate | Votes | % | ±% | |
|---|---|---|---|---|---|
| Conservative | David Michael Bryan* | Unopposed | |||
| Conservative gain from Independent | |||||
Hundleton
| Party | Candidate | Votes | % | ±% | |
|---|---|---|---|---|---|
| Independent | Margot Magdalena Hanna Mechthild Bateman | 334 | |||
| Conservative | Terence Keith Bradney | 174 | |||
| Independent | Nicky Hancock | 104 | |||
| Independent | Barry Edward Grange | 69 | |||
| Majority | 160 | ||||
| Independent hold | Swing | ||||
Johnston
| Party | Candidate | Votes | % | ±% | |
|---|---|---|---|---|---|
| Independent | Kenneth Rowlands* | 335 | |||
| Independent | Phillip Walter Hart | 313 | |||
| Labour | Rhys Daniel Evans | 141 | |||
| Majority | 22 | ||||
| Independent hold | Swing | ||||
Kilgetty / Begelly
| Party | Candidate | Votes | % | ±% | |
|---|---|---|---|---|---|
| Independent | David John Pugh* | 319 | |||
| Plaid Cymru | Gretta Elaine Marshall | 212 | |||
| Independent | Peter John Adams | 157 | |||
| Majority | 107 | ||||
| Independent hold | Swing | ||||
Lampeter Velfrey
| Party | Candidate | Votes | % | ±% | |
|---|---|---|---|---|---|
| Independent | David Simpson* | Unopposed | |||
| Independent hold | |||||
Lamphey
| Party | Candidate | Votes | % | ±% | |
|---|---|---|---|---|---|
| Independent | Tessa Hodgson* | 457 | |||
| Independent | Rob Kenningford | 256 | |||
| Majority | 201 | ||||
| Independent hold | Swing | ||||
Letterston
Tom Richards, who had held the seat as an Independent since 1995, chose to contest as a Conservative having only narrowly defeated a Conservative in 2012.
| Party | Candidate | Votes | % | ±% | |
|---|---|---|---|---|---|
| Independent | Michelle Elizabeth Bateman | 575 | |||
| Plaid Cymru | Owain Llyr Williams | 236 | |||
| Conservative | Thomas James Richards* | 224 | |||
| Majority | 339 | ||||
| Independent hold | Swing | ||||
Llangwm
| Party | Candidate | Votes | % | ±% | |
|---|---|---|---|---|---|
| Independent | Michael James John* | Unopposed | |||
| Independent hold | |||||
Llanrhian
| Party | Candidate | Votes | % | ±% | |
|---|---|---|---|---|---|
| Independent | Neil David Prior | 332 | |||
| Conservative | William John Evans | 159 | |||
| Independent | Alan Nigel Price | 155 | |||
| Plaid Cymru | Chris John | 48 | |||
| Majority | 173 | ||||
| Independent hold | Swing | ||||
Maenclochog
| Party | Candidate | Votes | % | ±% | |
|---|---|---|---|---|---|
| Independent | Huw Meredydd George* | 657 | |||
| Plaid Cymru | Hefin Wyn | 547 | |||
| Majority | 110 | ||||
| Independent hold | Swing | ||||
Manorbier
| Party | Candidate | Votes | % | ±% | |
|---|---|---|---|---|---|
| Independent | Philip Kidney* | Unopposed | |||
| Independent hold | |||||
Martletwy
| Party | Candidate | Votes | % | ±% | |
|---|---|---|---|---|---|
| Conservative | Di Clements | 591 | |||
| Independent | Robert Mark Lewis* | 263 | |||
| Majority | 328 | ||||
| Conservative gain from Independent | Swing | ||||
Merlin’s Bridge
| Party | Candidate | Votes | % | ±% | |
|---|---|---|---|---|---|
| Independent | Vincent John Cole | 337 | |||
| Independent | Paul Edmond Davies | 156 | |||
| Independent | Mary Umelda Havard* | 151 | |||
| Majority | 181 | ||||
| Independent hold | Swing | ||||
Milford Central
Stephen Joseph was elected as a Plaid Cymru candidate in 2012 but subsequently left the party.
| Party | Candidate | Votes | % | ±% | |
|---|---|---|---|---|---|
| Independent | Stephen Glanville Joseph* | 137 | |||
| Independent | Lynne Elizabeth Turner | 134 | |||
| Labour | Charles Davies | 118 | |||
| Conservative | Tony Miles | 113 | |||
| Independent | Meurig Caffery | 40 | |||
| Majority | 3 | ||||
| Independent gain from Plaid Cymru | Swing | ||||
Milford Hakin
| Party | Candidate | Votes | % | ±% | |
|---|---|---|---|---|---|
| Independent | Robert Michael Stoddart* | 336 | |||
| Labour | Jon Thrower | 225 | |||
| Independent | David Henry Worrall | 78 | |||
| Independent | William Dean Elliott | 68 | |||
| Independent | Rhys Williams | 31 | |||
| Majority | 111 | ||||
| Independent hold | Swing | ||||
Milford Hubberston
| Party | Candidate | Votes | % | ±% | |
|---|---|---|---|---|---|
| Independent | Vivien Stoddart* | 357 | |||
| Labour | Alun Emanuel Byrne | 163 | |||
| Independent | Rose Davinia Gray | 132 | |||
| Majority | 194 | ||||
| Independent hold | Swing | ||||
Milford North
| Party | Candidate | Votes | % | ±% | |
|---|---|---|---|---|---|
| Conservative | Stanley Thomas Hudson* | 487 | |||
| Independent | Colin Alan Sharp | 319 | |||
| Majority | 168 | ||||
| Conservative hold | Swing | ||||
Milford West
| Party | Candidate | Votes | % | ±% | |
|---|---|---|---|---|---|
| Plaid Cymru | David Rhys Sinnett* | 305 | |||
| Labour | Yvonne Grace Southwell | 118 | |||
| Independent | Carol Stevens | 67 | |||
| Majority | 187 | ||||
| Plaid Cymru hold | Swing | ||||
Narberth
| Party | Candidate | Votes | % | ±% | |
|---|---|---|---|---|---|
| Labour | Vic Dennis | 329 | |||
| Independent | Sue Rees | 301 | |||
| Conservative | Edward Rayner Peet | 145 | |||
| Majority | 28 | ||||
| Labour gain from Independent | Swing | ||||
Narberth Rural
| Party | Candidate | Votes | % | ±% | |
|---|---|---|---|---|---|
| Independent | Elwyn Albert Morse* | unopposed | |||
| Independent hold | Swing | ||||
Newport
| Party | Candidate | Votes | % | ±% | |
|---|---|---|---|---|---|
| Independent | Norman Paul Harries* | unopposed | |||
| Independent hold | Swing | ||||
Neyland East
| Party | Candidate | Votes | % | ±% | |
|---|---|---|---|---|---|
| Independent | Simon Leslie Hancock* | 763 | |||
| Plaid Cymru | Aelwen Mair Lee | 79 | |||
| Majority | 684 | ||||
| Independent hold | Swing | ||||
Neyland West
| Party | Candidate | Votes | % | ±% | |
|---|---|---|---|---|---|
| Labour | Paul Nigel Miller* | 512 | |||
| Independent | Brian Leslie Rothero | 217 | |||
| Majority | 295 | ||||
| Labour hold | Swing | ||||
Pembroke Monkton
| Party | Candidate | Votes | % | ±% | |
|---|---|---|---|---|---|
| Independent | Pearl Llewellyn* | 208 | |||
| Independent | Chris Doyle | 138 | |||
| Majority | 70 | ||||
| Independent hold | Swing | ||||
Pembroke St Mary North
| Party | Candidate | Votes | % | ±% | |
|---|---|---|---|---|---|
| Conservative | Dai Boswell | 217 | |||
| Independent | Jon Harvey | 211 | |||
| Labour | David William Edwards | 122 | |||
| Majority | 6 | ||||
| Conservative gain from Independent | Swing | ||||
Pembroke St Mary South
| Party | Candidate | Votes | % | ±% | |
|---|---|---|---|---|---|
| Conservative | Aaron Leigh Carey | 181 | |||
| Independent | Melanie Anne Phillips | 109 | |||
| Independent | Daphne Margaret Jane Bush* | 94 | |||
| Independent | Jacob David Taylor | 91 | |||
| Majority | 72 | ||||
| Conservative gain from Independent | Swing | ||||
Pembroke St Michael
| Party | Candidate | Votes | % | ±% | |
|---|---|---|---|---|---|
| Conservative | Aden Arthur Brinn | 557 | |||
| Independent | Jonathan Anthony Robert Nutting* | 425 | |||
| Majority | 132 | ||||
| Conservative gain from Independent | Swing | ||||
Pembroke Dock Central
| Party | Candidate | Votes | % | ±% | |
|---|---|---|---|---|---|
| Independent | Paul Heywood Dowson | 102 | 26 | ||
| Independent | Terry Wayne Judkins | 98 | 25 | ||
| Labour | Maureen Bowen | 81 | 20.6 | ||
| Independent | Phil Gwyther | 78 | 19.8 | ||
| Independent | George Frederick Manning | 21 | 5.3 | ||
| Plaid Cymru | Richard Day | 13 | 3.3 | ||
| Majority | 4 | 1 | |||
| Independent hold | Swing | ||||
Pembroke Dock Llanion
| Party | Candidate | Votes | % | ±% | |
|---|---|---|---|---|---|
| Labour | Joshua Beynon | 290 | 35.8 | ||
| Independent | Peter Frederick Stanley Kraus | 281 | 34.7 | ||
| Independent | William Skyrme Rees | 239 | 29.5 | ||
| Majority | 9 | 1.1 | |||
| Labour hold | Swing | ||||
Pembroke Dock Market
| Party | Candidate | Votes | % | ±% | |
|---|---|---|---|---|---|
| Independent | Brian John Hall* | 300 | 58.1 | ||
| Independent | Hayley Suzanne Wood | 216 | 41.9 | ||
| Majority | 84 | 16.2 | |||
| Independent hold | Swing | ||||
Pembroke Dock Pennar
| Party | Candidate | Votes | % | ±% | |
|---|---|---|---|---|---|
| Labour | Anthony Wilcox* | 727 | 75.3 | ||
| Independent | Allan Trevor Brookes | 239 | 24.7 | ||
| Majority | 488 | 50.6 | |||
| Labour hold | Swing | ||||
Penally
| Party | Candidate | Votes | % | ±% | |
|---|---|---|---|---|---|
| Plaid Cymru | Jonathan Spencer Preston* | 362 | |||
| Conservative | Christine Elizabeth Toy | 289 | |||
| Majority | 73 | ||||
| Plaid Cymru hold | Swing | ||||
Rudbaxton
Steve Yelland was elected as an Independent in 2012, defeating the sitting Conservative candidate
| Party | Candidate | Votes | % | ±% | |
|---|---|---|---|---|---|
| Conservative | Steve Yelland* | 273 | |||
| Independent | Raymond Burgess | 72 | |||
| Independent | Ryan Luke Dansie | 80 | |||
| Majority | 201 | ||||
| Conservative gain from Independent | Swing | ||||
St David's
| Party | Candidate | Votes | % | ±% | |
|---|---|---|---|---|---|
| Independent | David Gareth Beechey Lloyd* | 419 | |||
| Labour | Alan Charles York | 406 | |||
| Majority | 13 | ||||
| Independent hold | Swing | ||||
St Dogmaels
| Party | Candidate | Votes | % | ±% | |
|---|---|---|---|---|---|
| Independent | David Griffith Michael James* | 694 | |||
| Labour | Howard Stephen Balmer | 183 | |||
| Independent | Elfyn Owen Rees | 117 | |||
| Majority | 511 | ||||
| Independent hold | Swing | ||||
St Ishmael's
| Party | Candidate | Votes | % | ±% | |
|---|---|---|---|---|---|
| Independent | Reg Owens* | unopposed | |||
| Independent hold | Swing | ||||
Saundersfoot
| Party | Candidate | Votes | % | ±% | |
|---|---|---|---|---|---|
| Independent | Philip Raymond Baker* | 588 | |||
| Independent | Rosemary Rebecca Hayes | 322 | |||
| Majority | 266 | ||||
| Independent hold | Swing | ||||
Scleddau
Owen Watkin James was elected as a Conservative in 2008 and 2012.
| Party | Candidate | Votes | % | ±% | |
|---|---|---|---|---|---|
| Conservative | Samuel Deri Kurtz | 287 | |||
| Independent | Owen Watkin James* | 205 | |||
| Labour | Paul Frederick Stonhold | 103 | |||
| Majority | 82 | ||||
| Conservative hold | Swing | ||||
Solva
| Party | Candidate | Votes | % | ±% | |
|---|---|---|---|---|---|
| Conservative | Mark Metson Carter | 338 | |||
| Labour | Joshua David Phillips | 287 | |||
| Green | Janie Anne Harwood | 75 | |||
| Majority | 51 | ||||
| Conservative gain from Independent | Swing | ||||
Tenby North
| Party | Candidate | Votes | % | ±% | |
|---|---|---|---|---|---|
| Plaid Cymru | Michael Williams* | unopposed | |||
| Plaid Cymru hold | Swing | ||||
Tenby South
| Party | Candidate | Votes | % | ±% | |
|---|---|---|---|---|---|
| Independent | Michael Evans* | unopposed | |||
| Independent hold | Swing | ||||
The Havens
| Party | Candidate | Votes | % | ±% | |
|---|---|---|---|---|---|
| Independent | Peter John Morgan* | 346 | |||
| Conservative | Gordon William Smith | 238 | |||
| Majority | 108 | ||||
| Independent hold | Swing | ||||
Wiston
| Party | Candidate | Votes | % | ±% | |
|---|---|---|---|---|---|
| Conservative | David Kenneth Howlett* | 563 | |||
| Independent | Isabelle May Solomon | 211 | |||
| Majority | 352 | ||||
| Conservative hold | Swing | ||||
References
- "Wales local council elections 2017: All you need to know". BBC News. 3 April 2017. Retrieved 4 April 2017.
- "Statement of Persons Nominated". Pembrokeshire County Council. Retrieved 7 April 2017.
| Carmarthenshire County Council | |
|---|---|
| Ceredigion County Council | |
| Pembrokeshire County Council | |
| Dyfed County Council | |
| Carmarthen District Council | |
| Ceredigion District Council | |
| Dinefwr Borough Council | |
| Llanelli Borough Council | |
| Preseli Pembrokeshire District Council | |
| South Pembrokeshire District Council | |