Statistics of the COVID-19 pandemic in India
Maps
 Total Confirmed cases by state and union territory
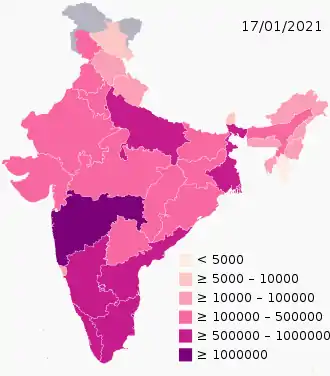 Confirmed cases per million population by state and union territory
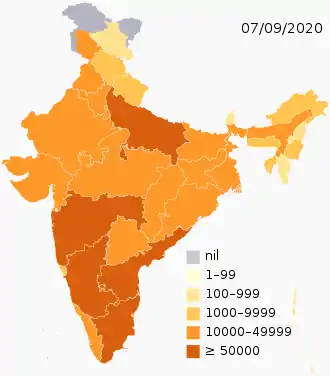 Active cases by state and union territory
 Deaths per million population by state and union territory
 Deaths by state and union territory
 Recoveries per million population by state and union territory
Interactive maps
|
|
|
Click the play button in the top left to interact with the map.
Hover over the regions for values.
|
|
|
Click the play button in the top left to interact with the map.
Hover over the regions for values.
Charts
Total confirmed cases, active cases, recoveries and deaths
Total confirmed cases Active cases Recoveries Deaths
Daily new cases
New cases per day 7-day moving average of new cases per day
Daily new deaths
New deaths per day 7-day moving average of new deaths per day
Notes:
Daily new recoveries
New recoveries per day 7-day moving average of new recoveries per day
Daily new cases vs active cases
New cases as percentage of active cases 7-day moving average of new cases as percentage of active cases 7-day moving CAGR of active cases
Confirmed cases by regions
See or edit raw graph data.
See or edit raw graph data.
See or edit raw graph data.
See or edit raw graph data.
See or edit raw graph data.
See or edit raw graph data.
Confirmed deaths by regions
See or edit raw graph data.
See or edit raw graph data.
See or edit raw graph data.
See or edit raw graph data.
See or edit raw graph data.
See or edit raw graph data.
Case fatality rate
The trend of case fatality rate for COVID-19 from 12 March, the day first death in the country was recorded.[3]
Case fatality rate
Total samples tested
Tested Samples
Daily samples tested
New tests per day
Positive sampling rate
Daily positive sampling ratio Total positive sampling ratio
References
- "India's death toll soars past 10K, backlog deaths raise count by 437 in Delhi, 1,409 in Maharashtra". Hindustan Times. 17 June 2020. Retrieved 17 June 2020.
- "45,720 new cases in 24 hrs, 13% positivity, single-day toll 1,129 after Tamil Nadu update". The Print. 23 July 2020. Retrieved 5 August 2020.
- "India's first coronavirus death is confirmed in Karnataka". Hindustan Times. 12 March 2020. Retrieved 27 March 2020.