Southern Metropolitan Region
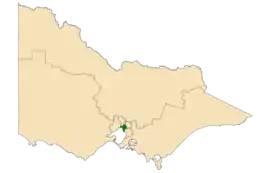
Southern Metropolitan Region is one of the eight electoral regions of Victoria, Australia, which elects five members to the Victorian Legislative Council (also referred to as the upper house) by proportional representation. The region was created in 2006 following the 2005 reform of the Victorian Legislative Council.
| Southern Metropolitan Region Victoria—Legislative Council | |
|---|---|
 Location of Southern Metropolitan Region (dark green) in Victoria | |
| State | Victoria |
| Created | 2006 |
| MP | Georgie Crozier (Liberal) David Davis (Liberal) Clifford Hayes (Sustainable) Nina Taylor (Labor) Enver Erdogan (Labor) |
| Party | Liberal (2) Labor (2) Sustainable (1) |
| Electors | 486,855 (2018) |
| Area | 233 km2 (90.0 sq mi) |
| Demographic | Metropolitan |
| Coordinates | 37°53′S 145°2′E |
The region comprises the Legislative Assembly districts of Albert Park, Bentleigh, Brighton, Burwood, Caulfield, Hawthorn, Kew, Malvern, Oakleigh, Prahran and Sandringham. The region covers most of the wealthiest areas of Melbourne, only a few traditional Labor areas (Oakleigh being the only historically safe Labor seat), and one of the three Greens-held seats in the lower house (Prahran).
Members
| Year | Member | Party | Member | Party | Member | Party | Member | Party | Member | Party | |||||
|---|---|---|---|---|---|---|---|---|---|---|---|---|---|---|---|
| 2006 | Sue Pennicuik | Greens | John Lenders | Labor | Evan Thornley | Labor | Andrea Coote | Liberal | David Davis | Liberal | |||||
| 2009 | Jennifer Huppert | Labor | |||||||||||||
| 2010 | Georgie Crozier | Liberal | |||||||||||||
| 2014 | Philip Dalidakis | Labor | Margaret Fitzherbert | Liberal | |||||||||||
| 2018 | Nina Taylor | Labor | Clifford Hayes | Sustainable | |||||||||||
| 2019 | Enver Erdogan | Labor | |||||||||||||
Returned MLCs by seat
Seats are allocated by single transferable vote using group voting tickets. Changes in party membership between elections have been omitted for simplicity.[1][2][3]
| Election | 1st MLC | 2nd MLC | 3rd MLC | 4th MLC | 5th MLC | |||||
|---|---|---|---|---|---|---|---|---|---|---|
| 2006 | Liberal (David Davis) |
Labor (John Lenders) |
Liberal (Andrea Coote) |
Greens (Sue Pennicuik) |
Labor (Evan Thornley) | |||||
| 2010 | Liberal (David Davis) |
Labor (John Lenders) |
Liberal (Andrea Coote) |
Liberal (Georgie Crozier) |
Greens (Sue Pennicuik) | |||||
| 2014 | Liberal (David Davis) |
Labor (Philip Dalidakis) |
Liberal (Georgie Crozier) |
Greens (Sue Pennicuik) |
Liberal (Margaret Fitzherbert) | |||||
| 2018 | Liberal (David Davis) |
Labor (Philip Dalidakis) |
Liberal (Georgie Crozier) |
Labor (Nina Taylor) |
Sustainable (Clifford Hayes) | |||||
Election results
The Liberals were defending three seats, and Labor and the Greens were defending one each.[4]
| Party | Candidate | Votes | % | ±% | |
|---|---|---|---|---|---|
| Quota | 71,610 | ||||
| Liberal | 1. David Davis (elected 1) 2. Georgie Crozier (elected 3) 3. Margaret Fitzherbert 4. Gavan MacRides 5. Miaosheng Yang |
164,607 | 38.29 | −4.43 | |
| Labor | 1. Philip Dalidakis (elected 2) 2. Nina Taylor (elected 4) 3. Judith Armstrong 4. Graeme Kendall 5. Danny Bellote |
148,656 | 34.58 | +9.38 | |
| Greens | 1. Sue Pennicuik 2. Earl James 3. Rose Read 4. Duncan Forster 5. James Bennett |
57,849 | 13.46 | −2.08 | |
| Animal Justice | 1. Ben Schultz 2. Fiona McRostie |
9,315 | 2.17 | +0.52 | |
| Reason | 1. Jill Mellon-Robertson 2. Edmund Munday |
8,587 | 2.00 | −0.43 | |
| Justice | 1. Nikki Nicholls 2. Julie Doidge |
6,178 | 1.44 | +1.44 | |
| Liberal Democrats | 1. Robert Kennedy 2. Kirsty O'Sullivan |
5,940 | 1.38 | −3.23 | |
| Sustainable Australia | 1. Clifford Hayes (elected 5) 2. Cathryn Houghton |
5,695 | 1.32 | +1.32 | |
| Democratic Labour | 1. Joel van der Horst 2. Lucia De Summa |
5,684 | 1.32 | −0.85 | |
| Voluntary Euthanasia | 1. Jane Morris 2. Imelda Ryan |
4,364 | 1.02 | +0.23 | |
| Shooters, Fishers, Farmers | 1. Nicole Bourman 2. Ryan Lindfors-Beswick |
2,726 | 0.63 | +0.16 | |
| Liberty Alliance | 1. Avi Yemini 2. Kaylah Jones |
2,096 | 0.49 | +0.49 | |
| Health Australia | 1. Ben Moore 2. Cindy Cerecer |
2,055 | 0.48 | +0.48 | |
| Victorian Socialists | 1. Catheryn Lewis 2. Ivan Mitchell |
2,046 | 0.48 | +0.48 | |
| Aussie Battler | 1. Mark Hillard 2. Stacey Wain |
1,700 | 0.40 | +0.40 | |
| Transport Matters | 1. Kim Guest 2. Saeed Muhammad |
1,375 | 0.32 | +0.32 | |
| Country | 1. Nicola Clow 2. Michele Armstrong |
711 | 0.17 | +0.08 | |
| Hudson for Northern Victoria | 1. Matthew Perriam 2. Grace Perriam |
342 | 0.08 | +0.08 | |
| Total formal votes | 429,657 | 97.33 | −0.10 | ||
| Informal votes | 11,801 | 2.67 | +0.10 | ||
| Turnout | 441458 | 89.31 | −2.56 | ||
References
- "State Election 2006 : Eastern Victorian Region". Victorian Electoral Commission.
- "State Election 2010 : Eastern Victorian Region". Victorian Electoral Commission.
- "State Election 2014 : Eastern Victorian Region". Victorian Electoral Commission.
- "State Election 2018: Southern Metropolitan Region results summary - Victorian Electoral Commission". www.vec.vic.gov.au. Retrieved 13 December 2018.
External links
- Southern Metropolitan Region, Victorian Electoral Commission
- Southern Metropolitan Region, Parliament of Victoria