Solar power in Portugal
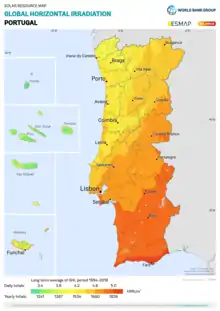
Solar power is a growing source in the Portuguese energy mix. At the end of 2018, solar power had a total installed capacity of 828 MW.[1] It represented 2.2% of total power generation in 2019.[2]

Photovoltaic Plants
The Serpa solar power plant is an 11 megawatt plant covered 150 acres (0.61 km2) and employs 52,000 PV panels. The panels are raised 2 meters off the ground thus allowing grazing to continue. The plant provides enough energy for 8,000 homes and saves an estimated 30,000 tonnes of carbon dioxide emissions per year.[3]
In February 2014, a solar plant was inaugurated in Coruche and it will generate 170 MWh per year. The owner, Society for Agroindustrial Development, expressed disappointment in the Portuguese laws which limit the production capacity for microgeneration and said that they only installed 1/10 of what they wanted. The plant will save 68 tonnes of carbon dioxide emissions per year.[4]
In 2019, a competitive auction for a new PV plant saw a worldwide record low bid of €14.76 per MWh, well below other generating technologies.[5] The auction awarded 1.150 MW of solar capacity to various companies, significantly more than the total installed capacity at the time. [6]
Solar power interest is growing exponentially in Portugal. João Galamba, the State Secretary for Energy, announced that more solar auctions would take place, including one in the second quarter of 2020 as well as that there were over 80,000 MW (80 GW) in projects awaiting analysis and approval.[7]
Total installed photovoltaics
| Year | Total Capacity in MWp |
Generation in GWhp |
Load Factor in per cent |
|---|---|---|---|
| 2005 | 3.0 | n.a. | n.a. |
| 2006 | 3.4 | n.a. | n.a. |
| 2007 | 17.9 | n.a. | n.a. |
| 2008 | 68.0 | n.a. | n.a. |
| 2009 | 102.2 | 160 | 17.8 |
| 2010 | 130.8 | 213 | 18.5 |
| 2011 | 143.6 | 277 | 22.0 |
| 2012 | 228.8 | 360 | 17.9 |
| 2013 | 277.9 | 437 | 17.9 |
| 2014 | 419.0 | 631 | 17.1 |
| Source: Photovoltaic Barometer, March 2015,[11] previous[12] | |||
See also
References
- "Evolution of the Installed Capacity of the Different Sources of Electricity Generation in Portugal between 2000 and 2019". APREN. Retrieved 2020-02-02.
- "Electricity Generation by Energy Sources in Mainland Portugal (january to december 2019)". APREN. Retrieved 2020-02-02.
- Portugal starts huge solar plant
- http://www.renovaveismagazine.pt/?p=5934
- Deign, Jason (9 August 2019). "Key to Those Record-Low Solar Bids? Rosy Merchant Income Assumptions". Greentech Media. Retrieved 12 August 2019.
- "LEILÕES DE ENERGIA SOLAR". LEILÕES DE ENERGIA SOLAR. August 7, 2019. Retrieved 2020-02-23.
- "Corrida ao sol: novos projetos para centrais solares quadruplicam a capacidade de produção atual". Expresso. 2020-02-17. Retrieved 2020-02-23.
- "Global Market Outlook for Photovoltaics 2014-2018" (PDF). epia.org. EPIA - European Photovoltaic Industry Association. p. 34. Archived from the original (PDF) on 12 June 2014. Retrieved 12 June 2014.
- collected historical data from article growth of photovoltaics
- "Snapshot of Global PV 1992-2014" (PDF). iea-pvps.org/index.php?id=32. International Energy Agency — Photovoltaic Power Systems Programme. 30 March 2015. Archived from the original on 30 March 2015.
- EUROBSER'VER (April 2015). "Photovoltaic Barometer - installations 2013 and 2014" (PDF). energies-renouvelables.org.
- http://www.energies-renouvelables.org/observ-er/stat_baro/observ/baro-jdp9.pdf