Results breakdown of the 1995 Spanish local elections (Navarre)
This is the results breakdown of the local elections held in Navarre on 28 May 1995. The following tables show detailed results in the autonomous community's most populous municipalities, sorted alphabetically.[1][2][3]
Overall
| Parties and coalitions | Popular vote | Councillors | ||||
|---|---|---|---|---|---|---|
| Votes | % | ±pp | Total | +/− | ||
| Navarrese People's Union (UPN)1 | 76,736 | 26.46 | +0.14 | 293 | +42 | |
| Socialist Party of Navarre (PSN–PSOE)2 | 55,530 | 19.15 | –8.64 | 235 | –65 | |
| Popular Unity (HB) | 24,472 | 8.44 | –1.36 | 125 | –13 | |
| Convergence of Democrats of Navarre (CDN) | 24,186 | 8.34 | New | 42 | +42 | |
| United Left (IU/EB) | 21,564 | 7.44 | +4.47 | 49 | +37 | |
| Basque Solidarity (EA) | 15,111 | 5.21 | +0.33 | 95 | +14 | |
| Assembly (Batzarre)3 | 6,025 | 2.08 | +0.05 | 3 | –6 | |
| Nationalists of Navarre (NA) | 2,702 | 0.93 | +0.06 | 17 | +3 | |
| Platform of Independents of Spain (PIE) | 2,177 | 0.75 | New | 11 | +11 | |
| Independents of Navarre (IN) | 1,820 | 0.63 | New | 6 | +6 | |
| Tudelan Union (UT) | 1,444 | 0.50 | New | 2 | +2 | |
| San Sebastián Independent Group (GISS) | 1,180 | 0.41 | –0.08 | 5 | –1 | |
| Independent Group of Zizur Mayor (AIZM) | 1,179 | 0.41 | New | 6 | +6 | |
| Alsasua Group (AA) | 1,036 | 0.36 | –0.02 | 4 | ±0 | |
| People's Group (HT) | 878 | 0.30 | –0.08 | 20 | +2 | |
| Unitary Candidacy of Estella (CUE/LKB) | 705 | 0.24 | +0.01 | 2 | ±0 | |
| People's Candidacy of the Aranguren Valley (CPVA) | 636 | 0.22 | +0.03 | 6 | –3 | |
| Independent Candidacy of Barañain (CIB) | 607 | 0.21 | New | 1 | +1 | |
| Others | 43,496 | 15.00 | — | 852 | –86 | |
| Blank ballots | 8,492 | 2.93 | +0.89 | |||
| Total | 289,976 | 1,774 | –8 | |||
| Valid votes | 289,976 | 98.63 | –0.10 | |||
| Invalid votes | 4,036 | 1.37 | +0.10 | |||
| Votes cast / turnout | 294,012 | 68.86 | +3.09 | |||
| Abstentions | 132,985 | 31.14 | –3.09 | |||
| Registered voters | 426,997 | |||||
| Sources[1][4] | ||||||
City control
The following table lists party control in the most populous municipalities, including provincial capitals (shown in bold).[1] Gains for a party are displayed with the cell's background shaded in that party's colour.
| Municipality | Population | Previous control | New control | ||
|---|---|---|---|---|---|
| Barañain | 18,946 | Socialist Party of Navarre (PSN–PSOE) | Navarrese People's Union (UPN) | ||
| Burlada | 15,690 | Socialist Party of Navarre (PSN–PSOE) | Socialist Party of Navarre (PSN–PSOE) | ||
| Estella | 12,861 | Socialist Party of Navarre (PSN–PSOE) | Socialist Party of Navarre (PSN–PSOE) | ||
| Pamplona | 182,465 | Navarrese People's Union (UPN) | Convergence of Democrats of Navarre (CDN) | ||
| Tafalla | 10,329 | Navarrese People's Union (UPN) | Navarrese People's Union (UPN) | ||
| Tudela | 27,303 | Socialist Party of Navarre (PSN–PSOE) | Navarrese People's Union (UPN) | ||
Municipalities
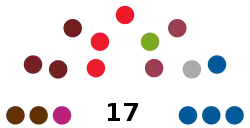
Barañain
- Population: 18,946
 | ||||||
| Parties and coalitions | Popular vote | Seats | ||||
|---|---|---|---|---|---|---|
| Votes | % | ±pp | Total | +/− | ||
| Navarrese People's Union (UPN) | 1,922 | 22.85 | –3.25 | 4 | –1 | |
| Socialist Party of Navarre (PSN–PSOE)1 | 1,365 | 16.23 | –23.40 | 3 | –4 | |
| United Left (IU/EB) | 1,313 | 15.61 | +9.62 | 3 | +2 | |
| Convergence of Democrats of Navarre (CDN) | 948 | 11.27 | New | 2 | +2 | |
| Popular Unity (HB) | 786 | 9.35 | –1.47 | 2 | ±0 | |
| Independent Candidacy of Barañain (CIB) | 607 | 7.22 | New | 1 | +1 | |
| Basque Solidarity (EA) | 573 | 6.81 | +0.73 | 1 | ±0 | |
| United Cendea Assembly (CUB) | 563 | 6.69 | –0.44 | 1 | ±0 | |
| Nationalists of Navarre (NA) | 104 | 1.24 | New | 0 | ±0 | |
| Blank ballots | 229 | 2.72 | +1.47 | |||
| Total | 8,410 | 17 | ±0 | |||
| Valid votes | 8,410 | 99.47 | +0.11 | |||
| Invalid votes | 45 | 0.53 | –0.11 | |||
| Votes cast / turnout | 8,455 | 59.64 | +1.88 | |||
| Abstentions | 5,721 | 40.36 | –1.88 | |||
| Registered voters | 14,176 | |||||
| Sources[1][5] | ||||||
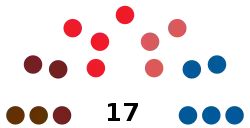
Burlada
- Population: 15,690
 | ||||||
| Parties and coalitions | Popular vote | Seats | ||||
|---|---|---|---|---|---|---|
| Votes | % | ±pp | Total | +/− | ||
| Navarrese People's Union (UPN) | 1,741 | 25.05 | +0.46 | 5 | ±0 | |
| Socialist Party of Navarre (PSN–PSOE)1 | 1,472 | 21.18 | –18.70 | 4 | –3 | |
| Independents of Navarre (IN) | 1,038 | 14.93 | New | 3 | +3 | |
| United Left (IU/EB) | 951 | 13.68 | +7.93 | 3 | +2 | |
| Popular Unity (HB) | 938 | 13.49 | –0.13 | 2 | –1 | |
| Assembly (Batzarre) | 321 | 4.62 | –0.99 | 0 | –1 | |
| Basque Solidarity (EA) | 302 | 4.34 | +0.08 | 0 | ±0 | |
| Blank ballots | 188 | 2.70 | +1.10 | |||
| Total | 6,951 | 17 | ±0 | |||
| Valid votes | 6,951 | 99.19 | +0.10 | |||
| Invalid votes | 57 | 0.81 | –0.10 | |||
| Votes cast / turnout | 7,008 | 56.09 | +3.19 | |||
| Abstentions | 5,487 | 43.91 | –3.19 | |||
| Registered voters | 12,495 | |||||
| Sources[1][6] | ||||||
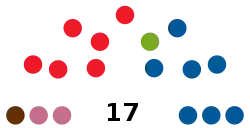
Estella
- Population: 12,861
 | ||||||
| Parties and coalitions | Popular vote | Seats | ||||
|---|---|---|---|---|---|---|
| Votes | % | ±pp | Total | +/− | ||
| Navarrese People's Union (UPN) | 2,547 | 38.04 | +4.32 | 7 | +1 | |
| Socialist Party of Navarre (PSN–PSOE)1 | 1,971 | 29.44 | –0.79 | 6 | ±0 | |
| Unitary Candidacy of Estella (CUE/LKB) | 705 | 10.53 | +0.73 | 2 | ±0 | |
| Popular Unity (HB) | 619 | 9.25 | –2.35 | 1 | –1 | |
| Basque Solidarity (EA) | 390 | 5.83 | –1.97 | 1 | ±0 | |
| Nationalists of Navarre (NA) | 322 | 4.81 | New | 0 | ±0 | |
| Blank ballots | 141 | 2.11 | +1.07 | |||
| Total | 6,695 | 17 | ±0 | |||
| Valid votes | 6,695 | 98.79 | –0.44 | |||
| Invalid votes | 82 | 1.21 | +0.44 | |||
| Votes cast / turnout | 6,777 | 65.81 | +1.20 | |||
| Abstentions | 3,521 | 34.19 | –1.20 | |||
| Registered voters | 10,298 | |||||
| Sources[1][7] | ||||||
Pamplona
- Population: 182,465
 | ||||||
| Parties and coalitions | Popular vote | Seats | ||||
|---|---|---|---|---|---|---|
| Votes | % | ±pp | Total | +/− | ||
| Navarrese People's Union (UPN) | 28,687 | 30.41 | –8.61 | 10 | –3 | |
| Convergence of Democrats of Navarre (CDN) | 19,247 | 20.40 | New | 6 | +6 | |
| Socialist Party of Navarre (PSN–PSOE)1 | 14,870 | 15.76 | –14.03 | 5 | –3 | |
| United Left (IU/EB) | 10,917 | 11.57 | +6.53 | 3 | +2 | |
| Popular Unity (HB) | 9,705 | 10.29 | –2.59 | 3 | –1 | |
| Basque Solidarity (EA) | 4,711 | 4.99 | –0.26 | 0 | –1 | |
| Assembly (Batzarre) | 3,276 | 3.47 | +0.19 | 0 | ±0 | |
| Nationalists of Navarre (NA) | 607 | 0.64 | –0.25 | 0 | ±0 | |
| Platform of Independents of Spain (PIE) | 358 | 0.38 | New | 0 | ±0 | |
| Blank ballots | 1,955 | 2.07 | +0.80 | |||
| Total | 94,333 | 27 | ±0 | |||
| Valid votes | 94,333 | 99.42 | –0.04 | |||
| Invalid votes | 546 | 0.58 | +0.04 | |||
| Votes cast / turnout | 94,879 | 64.53 | +6.05 | |||
| Abstentions | 52,162 | 35.47 | –6.05 | |||
| Registered voters | 147,041 | |||||
| Sources[1][8] | ||||||
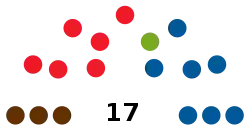
Tafalla
- Population: 10,329
 | ||||||
| Parties and coalitions | Popular vote | Seats | ||||
|---|---|---|---|---|---|---|
| Votes | % | ±pp | Total | +/− | ||
| Navarrese People's Union (UPN) | 2,187 | 36.91 | +4.25 | 7 | +1 | |
| Socialist Party of Navarre (PSN–PSOE) | 1,757 | 29.65 | –1.56 | 6 | ±0 | |
| Popular Unity (HB) | 955 | 16.12 | –3.52 | 3 | ±0 | |
| Basque Solidarity (EA) | 436 | 7.36 | +1.48 | 1 | ±0 | |
| United Left (IU/EB) | 215 | 3.63 | +0.72 | 0 | ±0 | |
| Platform of Independents of Spain (PIE) | 194 | 3.27 | New | 0 | ±0 | |
| Democratic and Social Centre (CDS) | n/a | n/a | –6.77 | 0 | –1 | |
| Blank ballots | 181 | 3.05 | +2.11 | |||
| Total | 5,925 | 17 | ±0 | |||
| Valid votes | 5,925 | 99.00 | –0.21 | |||
| Invalid votes | 60 | 1.00 | +0.21 | |||
| Votes cast / turnout | 5,985 | 70.83 | –2.95 | |||
| Abstentions | 2,465 | 29.17 | +2.95 | |||
| Registered voters | 8,450 | |||||
| Sources[1][9] | ||||||
Tudela
- Population: 27,303
 | ||||||
| Parties and coalitions | Popular vote | Seats | ||||
|---|---|---|---|---|---|---|
| Votes | % | ±pp | Total | +/− | ||
| Navarrese People's Union (UPN) | 5,748 | 37.14 | +2.60 | 10 | +2 | |
| Socialist Party of Navarre (PSN–PSOE) | 2,850 | 18.41 | –17.56 | 5 | –4 | |
| United Left (IU/EB) | 1,690 | 10.92 | +2.74 | 2 | ±0 | |
| Assembly (Batzarre)1 | 1,611 | 10.41 | –0.50 | 2 | ±0 | |
| Tudelan Union (UT) | 1,444 | 9.33 | New | 2 | +2 | |
| Platform of Independents of Spain (PIE) | 551 | 3.56 | New | 0 | ±0 | |
| Convergence of Democrats of Navarre (CDN) | 401 | 2.59 | New | 0 | ±0 | |
| Popular Unity (HB) | 291 | 1.88 | –1.60 | 0 | ±0 | |
| Independent Labour Association (ALIT) | 237 | 1.53 | New | 0 | ±0 | |
| Independents of Navarre (IN) | 192 | 1.24 | New | 0 | ±0 | |
| Basque Solidarity (EA) | 79 | 0.51 | –0.06 | 0 | ±0 | |
| Blank ballots | 383 | 2.47 | +0.59 | |||
| Total | 15,477 | 21 | ±0 | |||
| Valid votes | 15,477 | 98.92 | –0.19 | |||
| Invalid votes | 169 | 1.08 | +0.19 | |||
| Votes cast / turnout | 15,646 | 71.30 | +1.75 | |||
| Abstentions | 6,299 | 28.70 | –1.75 | |||
| Registered voters | 21,945 | |||||
| Sources[1][10] | ||||||
See also
References
- "Elecciones Municipales en Euskadi y Navarra (1979 - 2019)". Historia Electoral.com (in Spanish). Retrieved 25 March 2018.
- "Elecciones Municipales. 28 de mayo de 1995. Navarra". eldiario.es (in Spanish). Retrieved 16 August 2019.
- "28M/Elecciones Municipales 1995. Comunidad Foral de Navarra". Público (in Spanish). Retrieved 27 August 2019.
- "Electoral Results Consultation. Municipal. May 1995. Navarre". Ministry of the Interior (in Spanish). Retrieved 16 August 2019.
- "Electoral Results Consultation. Municipal. May 1995. Barañain Municipality". Ministry of the Interior (in Spanish). Retrieved 27 September 2019.
- "Electoral Results Consultation. Municipal. May 1995. Burlada Municipality". Ministry of the Interior (in Spanish). Retrieved 17 August 2019.
- "Electoral Results Consultation. Municipal. May 1995. Estella Municipality". Ministry of the Interior (in Spanish). Retrieved 17 August 2019.
- "Electoral Results Consultation. Municipal. May 1995. Pamplona Municipality". Ministry of the Interior (in Spanish). Retrieved 17 August 2019.
- "Electoral Results Consultation. Municipal. May 1995. Tafalla Municipality". Ministry of the Interior (in Spanish). Retrieved 17 August 2019.
- "Electoral Results Consultation. Municipal. May 1995. Tudela Municipality". Ministry of the Interior (in Spanish). Retrieved 17 August 2019.
This article is issued from Wikipedia. The text is licensed under Creative Commons - Attribution - Sharealike. Additional terms may apply for the media files.