Results breakdown of the 1991 Spanish local elections (Catalonia)
This is the results breakdown of the local elections held in Catalonia on 26 May 1991. The following tables show detailed results in the autonomous community's most populous municipalities, sorted alphabetically.[1][2][3][4]
Overall
| Parties and coalitions | Popular vote | Councillors | ||||
|---|---|---|---|---|---|---|
| Votes | % | ±pp | Total | +/− | ||
| Socialists' Party of Catalonia (PSC–PSOE) | 1,027,746 | 37.45 | –0.56 | 1,970 | +88 | |
| Unity of Aran–Aranese Nationalist Party (UA–PNA) | 1,090 | 0.04 | –0.01 | 15 | –5 | |
| Convergence and Union (CiU) | 915,464 | 33.36 | +0.38 | 4,361 | –12 | |
| Aranese Coalition–Convergence and Union (CA–CiU) | 2,137 | 0.08 | New | 32 | +32 | |
| Initiative for Catalonia (IC) | 264,368 | 9.63 | –0.92 | 276 | –47 | |
| People's Party (PP)1 | 184,128 | 6.71 | +0.97 | 256 | +35 | |
| Republican Left of Catalonia (ERC) | 91,995 | 3.35 | +0.87 | 228 | +40 | |
| Left Proposal for Catalonia–Party of the Communists of Catalonia (PEC–PCC) | 30,802 | 1.12 | New | 25 | +25 | |
| Left Proposal for Catalonia (PEC) | 6,813 | 0.25 | New | 16 | +16 | |
| Democratic and Social Centre (CDS) | 28,549 | 1.04 | –2.06 | 25 | –49 | |
| Green Alternative–Ecologist Party–Greens–Green Union (AV–PEC–EV–UVE) | 13,363 | 0.49 | +0.38 | 1 | +1 | |
| Ecologist Party of Catalonia–VERDE (PEC–VERDE) | 781 | 0.03 | –0.08 | 0 | ±0 | |
| The Greens Ecologist–Humanist List (LVLE–H)2 | 8,815 | 0.32 | +0.10 | 0 | ±0 | |
| Independents for the Municipal Progress of Osona (IPMO) | 7,490 | 0.27 | –0.12 | 72 | +24 | |
| Popular Unity Candidacy (CUP) | 6,279 | 0.23 | +0.05 | 15 | –1 | |
| Group of Independents, Progressives and Nationalists (AIPN) | 5,497 | 0.20 | –0.12 | 65 | –68 | |
| Catalan Left (EC) | 4,919 | 0.18 | New | 46 | +46 | |
| Union of Independents–Conca de Barberà (UNIC) | 3,664 | 0.13 | New | 65 | +65 | |
| Nationalist Left of Manresa (ENM) | 2,974 | 0.11 | +0.02 | 3 | +1 | |
| Workers' Socialist Party (PST) | 2,358 | 0.09 | +0.07 | 0 | ±0 | |
| Freixes Independent Group (Freixes) | 2,349 | 0.09 | –0.04 | 0 | –2 | |
| Free Catalonia (CLL) | 1,546 | 0.06 | New | 8 | +8 | |
| Democratic Municipal Action (AMD) | 1,137 | 0.04 | +0.01 | 19 | +7 | |
| Revolutionary Workers' Party of Spain (PORE) | 1,101 | 0.04 | –0.01 | 0 | ±0 | |
| Independent and Citizen Alternative Candidacy (CAIC) | 932 | 0.03 | New | 0 | ±0 | |
| Evangelical Social Action Party (PASE) | 919 | 0.03 | New | 0 | ±0 | |
| Others | 106,178 | 3.87 | — | 893 | –51 | |
| Blank ballots | 31,620 | 1.15 | –0.07 | |||
| Total | 2,744,193 | 100.00 | 8,328 | +110 | ||
| Valid votes | 2,744,193 | 99.44 | +0.48 | |||
| Invalid votes | 15,536 | 0.56 | –0.48 | |||
| Votes cast / turnout | 2,759,729 | 57.74 | –10.78 | |||
| Abstentions | 2,019,563 | 42.26 | +10.78 | |||
| Registered voters | 4,779,292 | |||||
| Sources[1][2][5][6] | ||||||
City control
The following table lists party control in the most populous municipalities, including provincial capitals (shown in bold).[1][2] Gains for a party are displayed with the cell's background shaded in that party's colour.
Municipalities
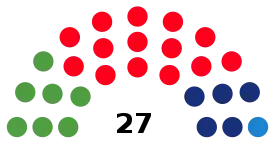
Badalona
- Population: 225,207
 | ||||||
| Parties and coalitions | Popular vote | Seats | ||||
|---|---|---|---|---|---|---|
| Votes | % | ±pp | Total | +/− | ||
| Socialists' Party of Catalonia (PSC–PSOE) | 36,228 | 46.87 | +3.93 | 14 | +1 | |
| Initiative for Catalonia (IC) | 17,730 | 22.94 | –8.20 | 7 | –3 | |
| Convergence and Union (CiU) | 12,560 | 16.25 | +1.71 | 5 | +1 | |
| People's Party (PP)1 | 4,741 | 6.13 | +2.51 | 1 | +1 | |
| Left Proposal for Catalonia–Party of the Communists of Catalonia (PEC–PCC) | 2,393 | 3.10 | New | 0 | ±0 | |
| Republican Left of Catalonia (ERC) | 1,278 | 1.65 | +0.49 | 0 | ±0 | |
| Democratic and Social Centre (CDS) | 966 | 1.25 | –2.24 | 0 | ±0 | |
| Workers' Socialist Party (PST) | 383 | 0.50 | New | 0 | ±0 | |
| Centrist Unity (PED) | 186 | 0.24 | New | 0 | ±0 | |
| Alliance for the Republic (AxR)2 | 125 | 0.16 | –0.17 | 0 | ±0 | |
| Blank ballots | 705 | 0.91 | –0.04 | |||
| Total | 77,295 | 27 | ±0 | |||
| Valid votes | 77,295 | 99.68 | +0.48 | |||
| Invalid votes | 250 | 0.32 | –0.48 | |||
| Votes cast / turnout | 77,545 | 46.43 | –16.20 | |||
| Abstentions | 89,456 | 53.57 | +16.20 | |||
| Registered voters | 167,001 | |||||
| Sources[1][2][7][8][9] | ||||||
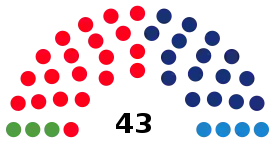
Barcelona
- Population: 1,707,286
 | ||||||
| Parties and coalitions | Popular vote | Seats | ||||
|---|---|---|---|---|---|---|
| Votes | % | ±pp | Total | +/− | ||
| Socialists' Party of Catalonia (PSC–PSOE) | 328,282 | 42.95 | –0.66 | 20 | –1 | |
| Convergence and Union (CiU) | 260,344 | 34.06 | –1.40 | 16 | –1 | |
| People's Party (PP)1 | 74,804 | 9.79 | +2.23 | 4 | +1 | |
| Initiative for Catalonia (IC) | 49,034 | 6.42 | +1.26 | 3 | +1 | |
| Republican Left of Catalonia (ERC) | 19,629 | 2.57 | +0.26 | 0 | ±0 | |
| Democratic and Social Centre (CDS) | 6,454 | 0.84 | –2.54 | 0 | ±0 | |
| The Greens Ecologist–Humanist List (LVLE–H)2 | 6,120 | 0.80 | +0.70 | 0 | ±0 | |
| Green Barcelona (BV) | 5,749 | 0.75 | New | 0 | ±0 | |
| Party of the Communists of Catalonia (PCC) | 3,168 | 0.41 | New | 0 | ±0 | |
| Workers' Socialist Party (PST) | 1,308 | 0.17 | New | 0 | ±0 | |
| Revolutionary Workers' Party of Spain (PORE) | 532 | 0.07 | –0.06 | 0 | ±0 | |
| Evangelical Social Action Party (PASE) | 514 | 0.07 | New | 0 | ±0 | |
| Alternative for Barcelona (AltBCN) | 428 | 0.06 | New | 0 | ±0 | |
| Alliance for the Republic (AxR)3 | 296 | 0.04 | –0.03 | 0 | ±0 | |
| Radical Centre of Catalonia (CRC) | 294 | 0.04 | New | 0 | ±0 | |
| Left Platform (PCE (m–l)–CRPE)4 | 210 | 0.03 | –0.09 | 0 | ±0 | |
| Centrist Unity (PED) | 198 | 0.03 | New | 0 | ±0 | |
| Blank ballots | 6,979 | 0.92 | +0.17 | |||
| Total | 764,343 | 43 | ±0 | |||
| Valid votes | 764,343 | 99.70 | +0.48 | |||
| Invalid votes | 2,177 | 0.30 | –0.48 | |||
| Votes cast / turnout | 766,520 | 55.50 | –13.43 | |||
| Abstentions | 614,628 | 44.50 | +13.43 | |||
| Registered voters | 1,381,148 | |||||
| Sources[1][2][7][10][11][12] | ||||||
Cornellà de Llobregat
- Population: 86,287
 | ||||||
| Parties and coalitions | Popular vote | Seats | ||||
|---|---|---|---|---|---|---|
| Votes | % | ±pp | Total | +/− | ||
| Socialists' Party of Catalonia (PSC–PSOE) | 18,720 | 55.17 | +3.61 | 16 | +1 | |
| Initiative for Catalonia (IC) | 6,482 | 19.10 | –5.28 | 5 | –2 | |
| Convergence and Union (CiU) | 4,091 | 12.06 | +2.01 | 3 | +1 | |
| People's Party (PP)1 | 1,798 | 5.30 | +0.47 | 1 | +1 | |
| Party of the Communists of Catalonia (PCC) | 1,453 | 4.28 | New | 0 | ±0 | |
| Democratic and Social Centre (CDS) | 683 | 2.01 | –4.06 | 0 | –1 | |
| Free Catalonia (CLL) | 430 | 1.27 | New | 0 | ±0 | |
| Blank ballots | 273 | 0.80 | –0.23 | |||
| Total | 33,930 | 25 | ±0 | |||
| Valid votes | 33,930 | 99.64 | +0.62 | |||
| Invalid votes | 123 | 0.36 | –0.62 | |||
| Votes cast / turnout | 34,053 | 49.72 | –16.28 | |||
| Abstentions | 34,436 | 50.28 | +16.28 | |||
| Registered voters | 68,489 | |||||
| Sources[1][2][7][13][14] | ||||||
Girona
- Population: 70,876
 | ||||||
| Parties and coalitions | Popular vote | Seats | ||||
|---|---|---|---|---|---|---|
| Votes | % | ±pp | Total | +/− | ||
| Socialists' Party of Catalonia (PSC–PSOE) | 14,451 | 47.54 | –0.90 | 13 | –1 | |
| Convergence and Union (CiU) | 9,361 | 30.79 | +1.42 | 9 | ±0 | |
| People's Party (PP)1 | 2,103 | 6.92 | +0.23 | 2 | ±0 | |
| Republican Left of Catalonia (ERC) | 1,729 | 5.69 | +0.97 | 1 | +1 | |
| Initiative for Catalonia (IC) | 1,250 | 4.11 | –0.78 | 0 | ±0 | |
| Democratic and Social Centre (CDS) | 416 | 1.37 | –2.78 | 0 | ±0 | |
| Party of the Communists of Catalonia (PCC) | 397 | 1.31 | New | 0 | ±0 | |
| Independentist and Unitary Ecologist Alternative (AEIU) | 358 | 1.18 | New | 0 | ±0 | |
| Blank ballots | 333 | 1.10 | +0.18 | |||
| Total | 30,398 | 25 | ±0 | |||
| Valid votes | 30,398 | 99.49 | +0.32 | |||
| Invalid votes | 155 | 0.51 | –0.32 | |||
| Votes cast / turnout | 30,553 | 58.03 | –9.04 | |||
| Abstentions | 22,100 | 41.97 | +9.04 | |||
| Registered voters | 52,653 | |||||
| Sources[1][2][7][15][16] | ||||||
L'Hospitalet de Llobregat
- Population: 276,198
 | ||||||
| Parties and coalitions | Popular vote | Seats | ||||
|---|---|---|---|---|---|---|
| Votes | % | ±pp | Total | +/− | ||
| Socialists' Party of Catalonia (PSC–PSOE) | 57,265 | 55.27 | –2.50 | 17 | ±0 | |
| Convergence and Union (CiU) | 16,115 | 15.55 | +1.37 | 5 | +1 | |
| Initiative for Catalonia (IC) | 12,333 | 11.90 | +1.37 | 3 | ±0 | |
| People's Party (PP)1 | 8,811 | 8.50 | +1.71 | 2 | +1 | |
| Democratic and Social Centre (CDS) | 2,464 | 2.38 | –4.99 | 0 | –2 | |
| The Greens Ecologist–Humanist List (LVLE–H)2 | 2,215 | 2.14 | +1.48 | 0 | ±0 | |
| Republican Left of Catalonia (ERC) | 1,474 | 1.42 | New | 0 | ±0 | |
| Party of the Communists of Catalonia (PCC) | 1,361 | 1.31 | New | 0 | ±0 | |
| Workers' Socialist Party (PST) | 667 | 0.64 | New | 0 | ±0 | |
| Left Platform (PCE (m–l)–CRPE) | 101 | 0.10 | New | 0 | ±0 | |
| Blank ballots | 799 | 0.77 | –0.20 | |||
| Total | 103,605 | 27 | ±0 | |||
| Valid votes | 103,605 | 99.68 | +0.80 | |||
| Invalid votes | 328 | 0.32 | –0.80 | |||
| Votes cast / turnout | 103,933 | 48.05 | –16.10 | |||
| Abstentions | 112,353 | 51.95 | +16.10 | |||
| Registered voters | 216,286 | |||||
| Sources[1][2][7][17][18] | ||||||
Lleida
- Population: 111,825
 | ||||||
| Parties and coalitions | Popular vote | Seats | ||||
|---|---|---|---|---|---|---|
| Votes | % | ±pp | Total | +/− | ||
| Socialists' Party of Catalonia (PSC–PSOE) | 24,029 | 49.38 | +12.07 | 17 | +5 | |
| Convergence and Union (CiU) | 12,453 | 25.59 | –7.18 | 8 | –3 | |
| People's Party (PP)1 | 3,911 | 8.04 | +0.67 | 2 | ±0 | |
| Initiative for Catalonia–Green Alternative (IC–AV)2 | 2,400 | 4.93 | –1.47 | 0 | ±0 | |
| Freixes Independent Group (Freixes) | 2,349 | 4.83 | –2.86 | 0 | –2 | |
| Republican Left of Catalonia (ERC) | 1,677 | 3.45 | +0.65 | 0 | ±0 | |
| Democratic and Social Centre (CDS) | 781 | 1.60 | –2.62 | 0 | ±0 | |
| Party of the Communists of Catalonia (PCC) | 333 | 0.68 | New | 0 | ±0 | |
| Group of Independents, Progressives and Nationalists (AIPN) | 79 | 0.16 | New | 0 | ±0 | |
| Blank ballots | 649 | 1.33 | +0.34 | |||
| Total | 48,661 | 27 | ±0 | |||
| Valid votes | 48,661 | 99.24 | –0.17 | |||
| Invalid votes | 374 | 0.76 | +0.17 | |||
| Votes cast / turnout | 49,035 | 56.22 | –8.40 | |||
| Abstentions | 38,180 | 43.78 | +8.40 | |||
| Registered voters | 87,215 | |||||
| Sources[1][2][7][19][20] | ||||||
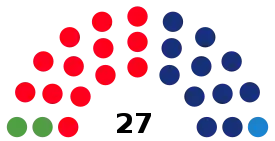
Mataró
- Population: 101,882
 | ||||||
| Parties and coalitions | Popular vote | Seats | ||||
|---|---|---|---|---|---|---|
| Votes | % | ±pp | Total | +/− | ||
| Socialists' Party of Catalonia (PSC–PSOE) | 19,073 | 42.23 | –3.13 | 13 | –1 | |
| Convergence and Union (CiU) | 16,145 | 35.75 | +2.20 | 11 | ±0 | |
| Initiative for Catalonia (IC) | 4,206 | 9.31 | +2.39 | 2 | ±0 | |
| People's Party (PP)1 | 2,582 | 5.72 | +1.30 | 1 | +1 | |
| Green Union (UVE) | 1,074 | 2.38 | New | 0 | ±0 | |
| Republican Left of Catalonia (ERC) | 638 | 1.41 | –1.76 | 0 | ±0 | |
| Democratic and Social Centre (CDS) | 535 | 1.18 | –2.60 | 0 | ±0 | |
| Left Proposal for Catalonia (PEC) | 367 | 0.81 | New | 0 | ±0 | |
| Free Catalonia (CLL) | 287 | 0.64 | New | 0 | ±0 | |
| Blank ballots | 258 | 0.57 | –0.19 | |||
| Total | 45,165 | 27 | ±0 | |||
| Valid votes | 45,165 | 99.73 | +0.65 | |||
| Invalid votes | 122 | 0.27 | –0.65 | |||
| Votes cast / turnout | 45,287 | 59.33 | –9.04 | |||
| Abstentions | 31,042 | 40.67 | +9.04 | |||
| Registered voters | 76,329 | |||||
| Sources[1][2][7][21][22] | ||||||
Reus
- Population: 86,407
 | ||||||
| Parties and coalitions | Popular vote | Seats | ||||
|---|---|---|---|---|---|---|
| Votes | % | ±pp | Total | +/− | ||
| Socialists' Party of Catalonia (PSC–PSOE) | 15,780 | 44.28 | +3.90 | 13 | +2 | |
| Convergence and Union (CiU) | 11,815 | 33.16 | +2.19 | 10 | +2 | |
| Republican Left of Catalonia (ERC) | 2,134 | 5.99 | –1.93 | 1 | –1 | |
| People's Party (PP)1 | 2,116 | 5.94 | –2.19 | 1 | –1 | |
| Initiative for Catalonia (IC) | 1,604 | 4.50 | –1.11 | 0 | –1 | |
| Party of the Communists of Catalonia (PCC) | 987 | 2.77 | New | 0 | ±0 | |
| Ecologist Party of Catalonia–VERDE (PEC–VERDE) | 781 | 2.19 | New | 0 | ±0 | |
| Democratic and Social Centre (CDS) | n/a | n/a | –6.07 | 0 | –1 | |
| Blank ballots | 417 | 1.17 | +0.24 | |||
| Total | 35,634 | 25 | ±0 | |||
| Valid votes | 35,634 | 99.57 | +0.55 | |||
| Invalid votes | 154 | 0.43 | –0.55 | |||
| Votes cast / turnout | 35,788 | 55.34 | –4.34 | |||
| Abstentions | 28,882 | 44.66 | +4.34 | |||
| Registered voters | 64,670 | |||||
| Sources[1][2][7][23][24] | ||||||
Sabadell
- Population: 192,142
 | ||||||
| Parties and coalitions | Popular vote | Seats | ||||
|---|---|---|---|---|---|---|
| Votes | % | ±pp | Total | +/− | ||
| Initiative for Catalonia (IC) | 36,990 | 48.94 | +1.94 | 15 | +1 | |
| Convergence and Union (CiU) | 14,931 | 19.75 | –2.62 | 6 | –1 | |
| Socialists' Party of Catalonia (PSC–PSOE) | 14,043 | 18.58 | –1.41 | 6 | ±0 | |
| People's Party (PP)1 | 3,355 | 4.44 | +1.00 | 0 | ±0 | |
| Left Proposal for Catalonia–Party of the Communists of Catalonia (PEC–PCC) | 1,685 | 2.23 | New | 0 | ±0 | |
| Republican Left of Catalonia (ERC) | 1,645 | 2.18 | +0.48 | 0 | ±0 | |
| Independent and Citizen Alternative Candidacy (CAIC) | 932 | 1.23 | New | 0 | ±0 | |
| Democratic and Social Centre (CDS) | 559 | 0.74 | –2.06 | 0 | ±0 | |
| Evangelical Social Action Party (PASE) | 405 | 0.54 | New | 0 | ±0 | |
| Revolutionary Workers' Party of Spain (PORE) | 301 | 0.40 | –0.02 | 0 | ±0 | |
| Catalan Left (EC) | 138 | 0.18 | New | 0 | ±0 | |
| Blank ballots | 598 | 0.79 | –0.08 | |||
| Total | 75,582 | 27 | ±0 | |||
| Valid votes | 75,582 | 99.69 | +0.30 | |||
| Invalid votes | 238 | 0.31 | –0.30 | |||
| Votes cast / turnout | 75,820 | 52.27 | –20.31 | |||
| Abstentions | 69,244 | 47.73 | +20.31 | |||
| Registered voters | 145,064 | |||||
| Sources[1][2][7][25][26] | ||||||
Sant Cugat del Vallès
- Population: 39,316
 | ||||||
| Parties and coalitions | Popular vote | Seats | ||||
|---|---|---|---|---|---|---|
| Votes | % | ±pp | Total | +/− | ||
| Convergence and Union (CiU) | 7,692 | 47.37 | +6.10 | 12 | +3 | |
| Socialists' Party of Catalonia (PSC–PSOE) | 3,650 | 22.48 | –12.94 | 5 | –3 | |
| Initiative for Catalonia (IC) | 1,750 | 10.78 | +2.10 | 2 | ±0 | |
| People's Party (PP)1 | 1,296 | 7.98 | –0.45 | 2 | ±0 | |
| Union of Independents (Ud'I) | 660 | 4.06 | New | 0 | ±0 | |
| Republican Left of Catalonia (ERC) | 636 | 3.92 | –0.34 | 0 | ±0 | |
| Democratic and Social Centre (CDS) | 255 | 1.57 | New | 0 | ±0 | |
| Alliance for the Republic (AxR) | 34 | 0.21 | New | 0 | ±0 | |
| Blank ballots | 265 | 1.63 | +0.50 | |||
| Total | 16,238 | 21 | ±0 | |||
| Valid votes | 16,238 | 99.44 | +0.51 | |||
| Invalid votes | 92 | 0.56 | –0.51 | |||
| Votes cast / turnout | 16,330 | 56.40 | –11.59 | |||
| Abstentions | 12,622 | 43.60 | +11.59 | |||
| Registered voters | 28,952 | |||||
| Sources[1][2][7][27][28] | ||||||
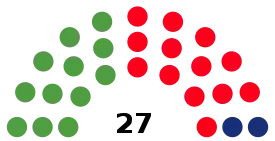
Santa Coloma de Gramenet
- Population: 135,486
 | ||||||
| Parties and coalitions | Popular vote | Seats | ||||
|---|---|---|---|---|---|---|
| Votes | % | ±pp | Total | +/− | ||
| Socialists' Party of Catalonia (PSC–PSOE) | 21,896 | 43.41 | +3.17 | 13 | +1 | |
| Initiative for Catalonia (IC) | 20,396 | 40.44 | –4.06 | 12 | –1 | |
| Convergence and Union (CiU) | 3,858 | 7.65 | +0.36 | 2 | ±0 | |
| People's Party (PP)1 | 1,527 | 3.03 | +0.55 | 0 | ±0 | |
| Party of the Communists of Catalonia (PCC) | 992 | 1.97 | New | 0 | ±0 | |
| The Greens Ecologist–Humanist List (LVLE–H)2 | 480 | 0.95 | +0.35 | 0 | ±0 | |
| Democratic and Social Centre (CDS) | 454 | 0.90 | –1.56 | 0 | ±0 | |
| Independent Association of Santa Coloma (AISC) | 364 | 0.72 | New | 0 | ±0 | |
| Republican Left of Catalonia (ERC) | 187 | 0.37 | New | 0 | ±0 | |
| Blank ballots | 285 | 0.57 | –0.08 | |||
| Total | 50,439 | 27 | ±0 | |||
| Valid votes | 50,439 | 99.74 | +0.44 | |||
| Invalid votes | 133 | 0.26 | –0.44 | |||
| Votes cast / turnout | 50,572 | 49.51 | –16.24 | |||
| Abstentions | 51,578 | 50.49 | +16.24 | |||
| Registered voters | 102,150 | |||||
| Sources[1][2][7][29][30] | ||||||
Tarragona
- Population: 112,360
 | ||||||
| Parties and coalitions | Popular vote | Seats | ||||
|---|---|---|---|---|---|---|
| Votes | % | ±pp | Total | +/− | ||
| Convergence and Union (CiU) | 22,627 | 44.10 | +11.76 | 14 | +4 | |
| Socialists' Party of Catalonia (PSC–PSOE) | 17,844 | 34.78 | –2.55 | 11 | –1 | |
| People's Party (PP)1 | 4,429 | 8.63 | –1.18 | 2 | –1 | |
| Green Alternative–Ecologist Movement of Catalonia (AV–MEC) | 1,960 | 3.82 | New | 0 | ±0 | |
| Initiative for Catalonia (IC) | 1,950 | 3.80 | –0.21 | 0 | ±0 | |
| Republican Left of Catalonia (ERC) | 1,612 | 3.14 | +0.54 | 0 | ±0 | |
| Democratic and Social Centre (CDS) | 560 | 1.09 | –6.21 | 0 | –2 | |
| Green Alternative (La Canonja) | 0 | 0.00 | New | 0 | ±0 | |
| Canonginan Unity Group (AdUC) | 0 | 0.00 | New | 0 | ±0 | |
| Blank ballots | 323 | 0.63 | –0.49 | |||
| Total | 51,305 | 27 | ±0 | |||
| Valid votes | 51,305 | 99.70 | +0.67 | |||
| Invalid votes | 153 | 0.30 | –0.67 | |||
| Votes cast / turnout | 51,458 | 60.60 | –3.56 | |||
| Abstentions | 33,454 | 39.40 | +3.56 | |||
| Registered voters | 84,912 | |||||
| Sources[1][2][7][31][32] | ||||||
Terrassa
- Population: 161,682
 | ||||||
| Parties and coalitions | Popular vote | Seats | ||||
|---|---|---|---|---|---|---|
| Votes | % | ±pp | Total | +/− | ||
| Socialists' Party of Catalonia (PSC–PSOE) | 30,455 | 47.90 | –0.29 | 15 | ±0 | |
| Convergence and Union (CiU) | 16,815 | 26.45 | +1.78 | 8 | ±0 | |
| Initiative for Catalonia (IC) | 5,237 | 8.24 | –2.54 | 2 | –1 | |
| People's Party (PP)1 | 4,507 | 7.09 | +1.81 | 2 | +1 | |
| The Greens (EV) | 2,241 | 3.53 | New | 0 | ±0 | |
| Republican Left of Catalonia (ERC) | 1,786 | 2.81 | –0.24 | 0 | ±0 | |
| Left Proposal for Catalonia–Party of the Communists of Catalonia (PEC–PCC) | 1,120 | 1.76 | New | 0 | ±0 | |
| Democratic and Social Centre (CDS) | 819 | 1.29 | –3.19 | 0 | ±0 | |
| Alliance for the Republic (AxR)2 | 70 | 0.11 | New | 0 | ±0 | |
| Blank ballots | 524 | 0.82 | –0.35 | |||
| Total | 63,574 | 27 | ±0 | |||
| Valid votes | 63,574 | 99.63 | +0.44 | |||
| Invalid votes | 237 | 0.37 | –0.44 | |||
| Votes cast / turnout | 63,811 | 51.44 | –13.21 | |||
| Abstentions | 60,248 | 48.56 | +13.21 | |||
| Registered voters | 124,059 | |||||
| Sources[1][2][7][33][34] | ||||||
References
- "Eleccions municipals a Catalunya (1979 - 2019). Capitals de comarca i ciutats de més de 25.000 habitants". Historia Electoral.com (in Catalan). Retrieved 11 August 2018.
- "Catalunya : Eleccions Municipals (1979 - 2019)". Historia Electoral.com (in Catalan). Retrieved 24 December 2018.
- "Elecciones Municipales. 26 de mayo de 1991. Catalunya". eldiario.es (in Spanish). Retrieved 7 June 2019.
- "26M/Elecciones Municipales 1991. Catalunya". Público (in Spanish). Retrieved 28 October 2018.
- "Election Results. Municipal Elections 1991. Catalonia". Government of Catalonia (in Catalan). Retrieved 22 December 2018.
- "Electoral Results Consultation. Municipal. May 1991. Catalonia". Ministry of the Interior (in Spanish). Retrieved 22 December 2018.
- "Local election results, 26 May 1991" (PDF). Central Electoral Commission (in Spanish). Retrieved 16 February 2018.
- "Election Results. Municipal Elections 1991. Badalona". Government of Catalonia (in Catalan). Retrieved 12 November 2017.
- "Electoral Results Consultation. Municipal. May 1991. Badalona Municipality". Ministry of the Interior (in Spanish). Retrieved 12 November 2017.
- "Election Results. Municipal Elections 1991. Barcelona". Government of Catalonia (in Catalan). Retrieved 12 November 2017.
- "Electoral Results Consultation. Municipal. May 1991. Barcelona Municipality". Ministry of the Interior (in Spanish). Retrieved 12 November 2017.
- "Eleccions municipals a Barcelona (1979 - 2015)". Historia Electoral.com (in Catalan). Retrieved 30 September 2017.
- "Election Results. Municipal Elections 1991. Cornellà de Llobregat". Government of Catalonia (in Catalan). Retrieved 1 January 2019.
- "Electoral Results Consultation. Municipal. May 1991. Cornellà de Llobregat Municipality". Ministry of the Interior (in Spanish). Retrieved 1 January 2019.
- "Election Results. Municipal Elections 1991. Girona". Government of Catalonia (in Catalan). Retrieved 12 November 2017.
- "Electoral Results Consultation. Municipal. May 1991. Girona Municipality". Ministry of the Interior (in Spanish). Retrieved 12 November 2017.
- "Election Results. Municipal Elections 1991. L'Hospitalet de Llobregat". Government of Catalonia (in Catalan). Retrieved 12 November 2017.
- "Electoral Results Consultation. Municipal. May 1991. L'Hospitalet de Llobregat Municipality". Ministry of the Interior (in Spanish). Retrieved 12 November 2017.
- "Election Results. Municipal Elections 1991. Lleida". Government of Catalonia (in Catalan). Retrieved 12 November 2017.
- "Electoral Results Consultation. Municipal. May 1991. Lleida Municipality". Ministry of the Interior (in Spanish). Retrieved 12 November 2017.
- "Election Results. Municipal Elections 1991. Mataró". Government of Catalonia (in Catalan). Retrieved 27 December 2018.
- "Electoral Results Consultation. Municipal. May 1991. Mataró Municipality". Ministry of the Interior (in Spanish). Retrieved 27 December 2018.
- "Election Results. Municipal Elections 1991. Reus". Government of Catalonia (in Catalan). Retrieved 27 December 2018.
- "Electoral Results Consultation. Municipal. May 1991. Reus Municipality". Ministry of the Interior (in Spanish). Retrieved 27 December 2018.
- "Election Results. Municipal Elections 1991. Sabadell". Government of Catalonia (in Catalan). Retrieved 12 November 2017.
- "Electoral Results Consultation. Municipal. May 1991. Sabadell Municipality". Ministry of the Interior (in Spanish). Retrieved 12 November 2017.
- "Election Results. Municipal Elections 1991. Sant Cugat del Vallès". Government of Catalonia (in Catalan). Retrieved 1 January 2019.
- "Electoral Results Consultation. Municipal. May 1991. Sant Cugat del Vallès Municipality". Ministry of the Interior (in Spanish). Retrieved 1 January 2019.
- "Election Results. Municipal Elections 1991. Santa Coloma de Gramenet". Government of Catalonia (in Catalan). Retrieved 27 December 2018.
- "Electoral Results Consultation. Municipal. May 1991. Santa Coloma de Gramenet Municipality". Ministry of the Interior (in Spanish). Retrieved 27 December 2018.
- "Election Results. Municipal Elections 1991. Tarragona". Government of Catalonia (in Catalan). Retrieved 12 November 2017.
- "Electoral Results Consultation. Municipal. May 1991. Tarragona Municipality". Ministry of the Interior (in Spanish). Retrieved 12 November 2017.
- "Election Results. Municipal Elections 1991. Terrassa". Government of Catalonia (in Catalan). Retrieved 12 November 2017.
- "Electoral Results Consultation. Municipal. May 1991. Terrassa Municipality". Ministry of the Interior (in Spanish). Retrieved 12 November 2017.
This article is issued from Wikipedia. The text is licensed under Creative Commons - Attribution - Sharealike. Additional terms may apply for the media files.