Poker probability
In poker, the probability of each type of 5-card hand can be computed by calculating the proportion of hands of that type among all possible hands.
History
Probability and gambling have been an idea since long before the invention of poker. The development of probability theory in the late 1400s was attributed to gambling; when playing a game with high stakes, players wanted to know what the chance of winning would be. In 1494, Fra Luca Paccioli released his work Summa de arithmetica, geometria, proportioni e proportionalita which was the first written text on probability. Motivated by Paccioli's work, Girolamo Cardano (1501-1576) made further developments in probability theory. His work from 1550, titled Liber de Ludo Aleae, discussed the concepts of probability and how they were directly related to gambling. However, his work did not receive any immediate recognition since it was not published until after his death. Blaise Pascal (1623-1662) also contributed to probability theory. His friend, Chevalier de Méré, was an avid gambler with the goal to become wealthy from it. De Méré tried a new mathematical approach to a gambling game but did not get the desired results. Determined to know why his strategy was unsuccessful, he consulted with Pascal. Pascal's work on this problem began an important correspondence between him and fellow mathematician Pierre de Fermat (1601-1665). Communicating through letters, the two continued to exchange their ideas and thoughts. These interactions led to the conception of basic probability theory. To this day, many gamblers still rely on the basic concepts of probability theory in order to make informed decisions while gambling.[1][2]
Frequency of 5-card poker hands

The following chart enumerates the (absolute) frequency of each hand, given all combinations of 5 cards randomly drawn from a full deck of 52 without replacement. Wild cards are not considered. In this chart:
- Distinct hands is the number of different ways to draw the hand, not counting different suits.
- Frequency is the number of ways to draw the hand, including the same card values in different suits.
- The Probability of drawing a given hand is calculated by dividing the number of ways of drawing the hand (Frequency) by the total number of 5-card hands (the sample space; ). For example, there are 4 different ways to draw a royal flush (one for each suit), so the probability is 4/2,598,960, or one in 649,740. One would then expect to draw this hand about once in every 649,740 draws, or nearly 0.000154% of the time.
- Cumulative probability refers to the probability of drawing a hand as good as or better than the specified one. For example, the probability of drawing three of a kind is approximately 2.11%, while the probability of drawing a hand at least as good as three of a kind is about 2.87%. The cumulative probability is determined by adding one hand's probability with the probabilities of all hands above it.
- The Odds are defined as the ratio of the number of ways not to draw the hand, to the number of ways to draw it. In statistics, this is called odds against. For instance, with a royal flush, there are 4 ways to draw one, and 2,598,956 ways to draw something else, so the odds against drawing a royal flush are 2,598,956 : 4, or 649,739 : 1. The formula for establishing the odds can also be stated as (1/p) - 1 : 1, where p is the aforementioned probability.
- The values given for Probability, Cumulative probability, and Odds are rounded off for simplicity; the Distinct hands and Frequency values are exact.
The nCr function on most scientific calculators can be used to calculate hand frequencies; entering nCr with 52 and 5, for example, yields as above.
| Hand | Distinct hands | Frequency | Probability | Cumulative probability | Odds against | Mathematical expression of absolute frequency |
|---|---|---|---|---|---|---|
| Royal flush
|
1 | 4 | 0.000154% | 0.000154% | 649,739 : 1 | |
| Straight flush (excluding royal flush)
|
9 | 36 | 0.00139% | 0.0015% | 72,192 1/3 : 1 | |
| Four of a kind
|
156 | 624 | 0.0240% | 0.0256% | 4,165 : 1 | |
| Full house
|
156 | 3,744 | 0.1441% | 0.17% | 693.17 : 1 | |
| Flush (excluding royal flush and straight flush)
|
1,277 | 5,108 | 0.1965% | 0.367% | 508.8 : 1 | |
| Straight (excluding royal flush and straight flush)
|
10 | 10,200 | 0.3925% | 0.76% | 253.8 : 1 | |
| Three of a kind
|
858 | 54,912 | 2.1128% | 2.87% | 46.33 : 1 | |
| Two pair
|
858 | 123,552 | 4.7539% | 7.62% | 20.0 : 1 | |
| One pair
|
2,860 | 1,098,240 | 42.2569% | 49.9% | 1.366 : 1 | |
| No pair / High card
|
1,277 | 1,302,540 | 50.1177% | 100% | 0.995 : 1 | |
| Total | 7,462 | 2,598,960 | 100% | --- | 0 : 1 |
The royal flush is a case of the straight flush. It can be formed 4 ways (one for each suit), giving it a probability of 0.000154% and odds of 649,739 : 1.
When ace-low straights and ace-low straight flushes are not counted, the probabilities of each are reduced: straights and straight flushes each become 9/10 as common as they otherwise would be. The 4 missed straight flushes become flushes and the 1,020 missed straights become no pair.
Note that since suits have no relative value in poker, two hands can be considered identical if one hand can be transformed into the other by swapping suits. For example, the hand 3♣ 7♣ 8♣ Q♠ A♠ is identical to 3♦ 7♦ 8♦ Q♥ A♥ because replacing all of the clubs in the first hand with diamonds and all of the spades with hearts produces the second hand. So eliminating identical hands that ignore relative suit values, there are only 134,459 distinct hands.
The number of distinct poker hands is even smaller. For example, 3♣ 7♣ 8♣ Q♠ A♠ and 3♦ 7♣ 8♦ Q♥ A♥ are not identical hands when just ignoring suit assignments because one hand has three suits, while the other hand has only two—that difference could affect the relative value of each hand when there are more cards to come. However, even though the hands are not identical from that perspective, they still form equivalent poker hands because each hand is an A-Q-8-7-3 high card hand. There are 7,462 distinct poker hands.
Frequency of 7-card poker hands
In some popular variations of poker such as Texas Hold 'Em, a player uses the best five-card poker hand out of seven cards. The frequencies are calculated in a manner similar to that shown for 5-card hands, except additional complications arise due to the extra two cards in the 7-card poker hand. The total number of distinct 7-card hands is . It is notable that the probability of a no-pair hand is less than the probability of a one-pair or two-pair hand.
The Ace-high straight flush or royal flush is slightly more frequent (4324) than the lower straight flushes (4140 each) because the remaining two cards can have any value; a King-high straight flush, for example, cannot have the Ace of its suit in the hand (as that would make it ace-high instead).
Hand Frequency Probability Cumulative Odds against Mathematical expression of absolute frequency Royal flush

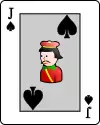
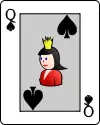
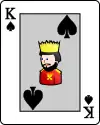
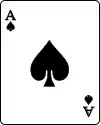
4,324 0.0032% 0.0032% 30,939 : 1 Straight flush (excluding royal flush)


37,260 0.0279% 0.0311% 3,589.6 : 1 Four of a kind


224,848 0.168% 0.199% 594 : 1 Full house


3,473,184 2.60% 2.80% 35.7 : 1 Flush (excluding royal flush and straight flush)


4,047,644 3.03% 5.82% 32.1 : 1 Straight (excluding royal flush and straight flush)


6,180,020 4.62% 10.4% 20.6 : 1 Three of a kind


6,461,620 4.83% 15.3% 19.7 : 1 Two pair


31,433,400 23.5% 38.8% 3.26 : 1 One pair


58,627,800 43.8% 82.6% 1.28 : 1 No pair / High card


23,294,460 17.4% 100% 4.74 : 1 Total 133,784,560 100% --- 0 : 1
(The frequencies given are exact; the probabilities and odds are approximate.)
Since suits have no relative value in poker, two hands can be considered identical if one hand can be transformed into the other by swapping suits. Eliminating identical hands that ignore relative suit values leaves 6,009,159 distinct 7-card hands.
The number of distinct 5-card poker hands that are possible from 7 cards is 4,824. Perhaps surprisingly, this is fewer than the number of 5-card poker hands from 5 cards because some 5-card hands are impossible with 7 cards (e.g. 7-high).
Frequency of 5-card lowball poker hands
Some variants of poker, called lowball, use a low hand to determine the winning hand. In most variants of lowball, the ace is counted as the lowest card and straights and flushes don't count against a low hand, so the lowest hand is the five-high hand A-2-3-4-5, also called a wheel. The probability is calculated based on , the total number of 5-card combinations. (The frequencies given are exact; the probabilities and odds are approximate.)
Hand Distinct hands Frequency Probability Cumulative Odds against 5-high 1 1,024 0.0394% 0.0394% 2,537.05 : 1 6-high 5 5,120 0.197% 0.236% 506.61 : 1 7-high 15 15,360 0.591% 0.827% 168.20 : 1 8-high 35 35,840 1.38% 2.21% 71.52 : 1 9-high 70 71,680 2.76% 4.96% 35.26 : 1 10-high 126 129,024 4.96% 9.93% 19.14 : 1 Jack-high 210 215,040 8.27% 18.2% 11.09 : 1 Queen-high 330 337,920 13.0% 31.2% 6.69 : 1 King-high 495 506,880 19.5% 50.7% 4.13 : 1 Total 1,287 1,317,888 50.7% 50.7% 0.97 : 1
As can be seen from the table, just over half the time a player gets a hand that has no pairs, three- or four-of-a-kinds. (50.7%)
If aces are not low, simply rotate the hand descriptions so that 6-high replaces 5-high for the best hand and ace-high replaces king-high as the worst hand.
Frequency of 7-card lowball poker hands
In some variants of poker a player uses the best five-card low hand selected from seven cards. In most variants of lowball, the ace is counted as the lowest card and straights and flushes don't count against a low hand, so the lowest hand is the five-high hand A-2-3-4-5, also called a wheel. The probability is calculated based on , the total number of 7-card combinations.
The table does not extend to include five-card hands with at least one pair. Its "Total" represents the 95.4% of the time that a player can select a 5-card low hand without any pair.
Hand Frequency Probability Cumulative Odds against 5-high 781,824 0.584% 0.584% 170.12 : 1 6-high 3,151,360 2.36% 2.94% 41.45 : 1 7-high 7,426,560 5.55% 8.49% 17.01 : 1 8-high 13,171,200 9.85% 18.3% 9.16 : 1 9-high 19,174,400 14.3% 32.7% 5.98 : 1 10-high 23,675,904 17.7% 50.4% 4.65 : 1 Jack-high 24,837,120 18.6% 68.9% 4.39 : 1 Queen-high 21,457,920 16.0% 85.0% 5.23 : 1 King-high 13,939,200 10.4% 95.4% 8.60 : 1 Total 127,615,488 95.4% 95.4% 0.05 : 1
(The frequencies given are exact; the probabilities and odds are approximate.)
If aces are not low, simply rotate the hand descriptions so that 6-high replaces 5-high for the best hand and ace-high replaces king-high as the worst hand.
See also
Notes
- "Probability Theory". Science Clarified. Retrieved 7 December 2015.
- "Brief History of Probability". teacher link. Retrieved 7 December 2015.
External links
- Brian Alspach's mathematics and poker page
- MathWorld: Poker
- Poker probabilities including conditional calculations
- Numerous poker probability tables
- 5, 6, and 7 card poker probabilities
- Poker Odds for Dummies
- The 7,462 and 4,824 equivalence classes
- Preflop, After Flop and Chance of Making Hand Odds
- Odds and Outs probability table
- Poker probability calculator 5, 6 and 7 cards
- Visual odds calculator