Maria, Siquijor
Maria, officially the Municipality of Maria (Cebuano: Lungsod sa Maria; Tagalog: Bayan ng Maria), is a 5th class municipality in the province of Siquijor, Philippines. According to the 2015 census, it has a population of 13,828. [3]
Maria | |
|---|---|
| Municipality of Maria | |
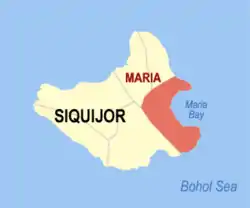 Map of Siquijor with Maria highlighted | |
OpenStreetMap 
| |
.svg.png.webp) Maria Location within the Philippines | |
| Coordinates: 9°11′N 123°38′E | |
| Country | |
| Region | Central Visayas (Region VII) |
| Province | Siquijor |
| District | Lone district of Siquijor |
| Barangays | 22 (see Barangays) |
| Government | |
| • Type | Sangguniang Bayan |
| • Mayor | Meynard R. Asok |
| • Vice Mayor | Ivy Dan M. Samson |
| • Representative | Jake Vincent S. Villa |
| • Electorate | 11,157 voters (2019) |
| Area | |
| • Total | 53.37 km2 (20.61 sq mi) |
| Elevation | 100 m (300 ft) |
| Population | |
| • Total | 13,828 |
| • Density | 260/km2 (670/sq mi) |
| • Households | 3,152 |
| Economy | |
| • Income class | 5th municipal income class |
| • Poverty incidence | 37.66% (2015)[4] |
| • Revenue | ₱55,237,035.66 (2016) |
| Time zone | UTC+8 (PST) |
| ZIP code | 6229 |
| PSGC | |
| IDD : area code | +63 (0)35 |
| Climate type | tropical monsoon climate |
| Native languages | Cebuano Tagalog |
Barangays
Maria comprises 22 barangays:
| PSGC | Barangay | Population | ±% p.a. | |||
|---|---|---|---|---|---|---|
| 2015 [3] | 2010 [5] | |||||
| 076104001 | Bogo | 6.1% | 842 | 739 | 2.52% | |
| 076104002 | Bonga | 3.7% | 506 | 459 | 1.87% | |
| 076104003 | Cabal‑asan | 2.8% | 387 | 357 | 1.55% | |
| 076104004 | Calunasan | 4.6% | 634 | 641 | −0.21% | |
| 076104005 | Candaping A | 4.1% | 562 | 448 | 4.41% | |
| 076104006 | Candaping B | 4.5% | 622 | 591 | 0.98% | |
| 076104007 | Cantaroc A | 3.2% | 448 | 385 | 2.93% | |
| 076104008 | Cantaroc B | 3.5% | 484 | 411 | 3.16% | |
| 076104009 | Cantugbas | 2.8% | 386 | 400 | −0.68% | |
| 076104010 | Lico‑an | 3.6% | 494 | 529 | −1.29% | |
| 076104011 | Lilo‑an | 10.2% | 1,414 | 1,470 | −0.74% | |
| 076104013 | Logucan | 4.4% | 615 | 557 | 1.90% | |
| 076104012 | Looc | 3.4% | 466 | 528 | −2.35% | |
| 076104014 | Minalulan | 5.8% | 797 | 703 | 2.42% | |
| 076104015 | Nabutay | 6.7% | 922 | 718 | 4.88% | |
| 076104016 | Olang | 4.8% | 659 | 592 | 2.06% | |
| 076104017 | Pisong A | 2.4% | 329 | 292 | 2.30% | |
| 076104018 | Pisong B | 2.0% | 274 | 293 | −1.27% | |
| 076104019 | Poblacion Norte | 7.9% | 1,089 | 1,170 | −1.36% | |
| 076104020 | Poblacion Sur | 5.2% | 716 | 675 | 1.13% | |
| 076104021 | Saguing | 5.8% | 797 | 946 | −3.21% | |
| 076104022 | Sawang | 2.8% | 385 | 479 | −4.07% | |
| Total | 13,828 | 13,383 | 0.62% | |||
Climate
| Climate data for Maria, Siquijor | |||||||||||||
|---|---|---|---|---|---|---|---|---|---|---|---|---|---|
| Month | Jan | Feb | Mar | Apr | May | Jun | Jul | Aug | Sep | Oct | Nov | Dec | Year |
| Average high °C (°F) | 29 (84) |
30 (86) |
31 (88) |
32 (90) |
31 (88) |
30 (86) |
30 (86) |
30 (86) |
30 (86) |
29 (84) |
29 (84) |
29 (84) |
30 (86) |
| Average low °C (°F) | 22 (72) |
22 (72) |
22 (72) |
23 (73) |
24 (75) |
24 (75) |
24 (75) |
24 (75) |
24 (75) |
24 (75) |
23 (73) |
23 (73) |
23 (74) |
| Average precipitation mm (inches) | 26 (1.0) |
22 (0.9) |
28 (1.1) |
41 (1.6) |
95 (3.7) |
136 (5.4) |
147 (5.8) |
126 (5.0) |
132 (5.2) |
150 (5.9) |
98 (3.9) |
46 (1.8) |
1,047 (41.3) |
| Average rainy days | 7.5 | 6.7 | 8.9 | 10.4 | 21.6 | 25.6 | 26.3 | 25.0 | 24.1 | 26.2 | 19.2 | 12.1 | 213.6 |
| Source: Meteoblue [6] | |||||||||||||
Demographics
|
| ||||||||||||||||||||||||||||||||||||||||||||||||
| Source: Philippine Statistics Authority [3] [5] [7][8] | |||||||||||||||||||||||||||||||||||||||||||||||||
References
- Municipality of Maria | (DILG)
- "Province: Siquijor". PSGC Interactive. Quezon City, Philippines: Philippine Statistics Authority. Retrieved 12 November 2016.
- Census of Population (2015). "Region VII (Central Visayas)". Total Population by Province, City, Municipality and Barangay. PSA. Retrieved 20 June 2016.
- "PSA releases the 2015 Municipal and City Level Poverty Estimates". Quezon City, Philippines. Retrieved 12 October 2019.
- Census of Population and Housing (2010). "Region VII (Central Visayas)". Total Population by Province, City, Municipality and Barangay. NSO. Retrieved 29 June 2016.
- "Maria: Average Temperatures and Rainfall". Meteoblue. Retrieved 28 April 2020.
- Censuses of Population (1903–2007). "Region VII (Central Visayas)". Table 1. Population Enumerated in Various Censuses by Province/Highly Urbanized City: 1903 to 2007. NSO.
- "Province of Siquijor". Municipality Population Data. Local Water Utilities Administration Research Division. Retrieved 17 December 2016.
External links
| Wikimedia Commons has media related to Maria. |
Places adjacent to Maria, Siquijor | ||||||||||
|---|---|---|---|---|---|---|---|---|---|---|
| ||||||||||
Siquijor (capital) | |
| Municipalities | |
| Authority control |
|---|
This article is issued from Wikipedia. The text is licensed under Creative Commons - Attribution - Sharealike. Additional terms may apply for the media files.