List of Irish counties by population
This is a list of counties of Ireland ordered by population. Counties in the Republic of Ireland are shown in normal type, while those in Northern Ireland are listed in italic type. Non-traditional administrative counties are indicated by a cream-coloured background.
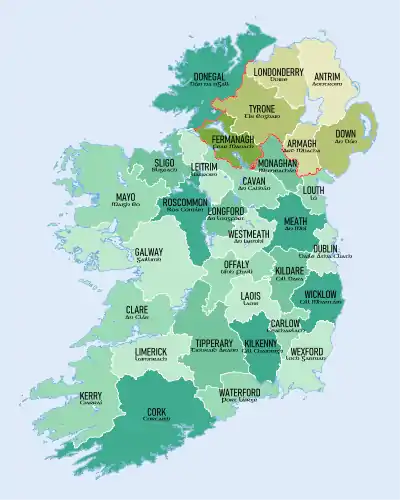
The 32 traditional counties of Ireland
For a more detailed analysis of current and historical Irish populations in the Republic of Ireland, see Irish population analysis. The population of the six counties of Northern Ireland as of 2011 is 1,810,863[1] which would mean a total population on the island of Ireland as of 2016 of approximately 6,568,839
Data source (as of July 2016):
- Taken from latest census data for the Republic of Ireland[2] and Northern Ireland.
- Population data for counties in the Republic of Ireland is based on preliminary data from census of 2016.
- Population data for counties in Northern Ireland is based on census of 2011.
- The previous census for the Republic of Ireland was taken in 2011, the previous census for Northern Ireland was taken in 2001.
- Density based on census of 2016.[3]
| Rank | County | Population | Density (km²) | Traditional province | Change since previous census |
|---|---|---|---|---|---|
| 1 | Dublin | 1,345,402 | 1,459.2 | Leinster | |
| 2 | Antrim | 618,108 | 202.9 | Ulster | |
| 3 | Cork | 542,868 | 72.3 | Munster | |
| 4 | Down | 531,665 | 215.6 | Ulster | |
| – | Fingal | 296,020 | 651.6 | Leinster | |
| – | South Dublin | 278,767 | 1,251.5 | Leinster | |
| 5 | Galway | 258,058 | 42.0 | Connacht | |
| 6 | Londonderry | 247,132 | 119.1 | Ulster | |
| 7 | Kildare | 222,504 | 131.0 | Leinster | |
| – | Dún Laoghaire–Rathdown | 218,018 | 1,706.7 | Leinster | |
| 8 | Meath | 195,044 | 83.2 | Leinster | |
| 9 | Limerick | 194,899 | 70.8 | Munster | |
| 10 | Tyrone | 179,000 | 54.5 | Ulster | |
| 11 | Armagh | 174,792 | 131.8 | Ulster | |
| 12 | Tipperary | 159,553 | 37.2 | Munster | |
| 13 | Donegal | 159,192 | 32.6 | Ulster | |
| 14 | Wexford | 149,722 | 63.2 | Leinster | |
| 15 | Kerry | 147,707 | 30.7 | Munster | |
| 16 | Wicklow | 142,425 | 70.2 | Leinster | |
| 17 | Mayo | 130,507 | 23.3 | Connacht | |
| 18 | Louth | 128,884 | 155.4 | Leinster | |
| 19 | Clare | 118,817 | 34.4 | Munster | |
| 20 | Waterford | 116,176 | 62.7 | Munster | |
| 21 | Kilkenny | 99,232 | 47.8 | Leinster | |
| 22 | Westmeath | 88,770 | 48.2 | Leinster | |
| 23 | Laois | 84,697 | 49.3 | Leinster | |
| 24 | Offaly | 77,961 | 38.9 | Leinster | |
| 25 | Cavan | 76,176 | 39.3 | Ulster | |
| 26 | Sligo | 65,535 | 35.5 | Connacht | |
| 27 | Roscommon | 64,544 | 25.3 | Connacht | |
| 28 | Monaghan | 61,386 | 47.3 | Ulster | |
| 29 | Fermanagh | 61,170 | 36.1 | Ulster | |
| 30 | Carlow | 56,932 | 63.4 | Leinster | |
| 31 | Longford | 40,873 | 37.4 | Leinster | |
| 32 | Leitrim | 32,044 | 20.1 | Connacht | |
| Total | Island of Ireland | 6,573,732 | 77.9 | ||
| Average | 205,429 |
See also
Notes
References
- "Archived copy" (PDF). Archived from the original (PDF) on 2012-12-24. Retrieved 2014-12-16.CS1 maint: archived copy as title (link) NISRA Key Report, 2011
- Central Statistics Office figures
- Census 2016
This article is issued from Wikipedia. The text is licensed under Creative Commons - Attribution - Sharealike. Additional terms may apply for the media files.