Kensington North (UK Parliament constituency)
Kensington North was a parliamentary constituency centred on the Kensington district of west London. It returned one Member of Parliament to the House of Commons of the Parliament of the United Kingdom.
| Kensington North | |
|---|---|
| Former Borough constituency for the House of Commons | |
| 1885–February 1974 | |
| Number of members | One |
| Replaced by | Kensington |
| Created from | Chelsea |
The constituency was created for the 1885 general election, and abolished for the February 1974 general election.
Boundaries

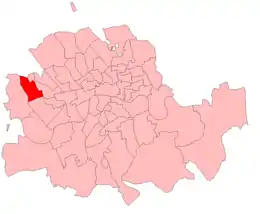
Kensington North in the Metropolitan area from 1885-1918

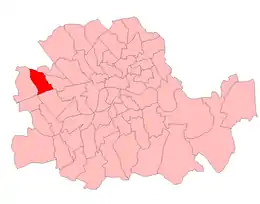
Kensington North in London from 1918-50

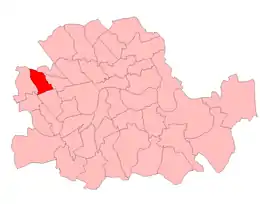
Kensington North in London from 1950-74

wards of Kensington Metropolitan Borough in 1916
1918–1974: The Royal Borough of Kensington wards of Golborne, Norland, Pembridge, and St Charles.
Members of Parliament
Election results
Elections in the 1880s
| Party | Candidate | Votes | % | ±% | |
|---|---|---|---|---|---|
| Conservative | Roper Lethbridge | 3,619 | 54.6 | ||
| Liberal | Joseph Bottomley Firth | 3,011 | 45.4 | ||
| Majority | 608 | 9.2 | |||
| Turnout | 6,630 | 79.9 | |||
| Registered electors | 8,297 | ||||
| Conservative win (new seat) | |||||
| Party | Candidate | Votes | % | ±% | |
|---|---|---|---|---|---|
| Conservative | Roper Lethbridge | 3,394 | 58.1 | +3.5 | |
| Liberal | Edmund Routledge | 2,443 | 41.9 | -3.5 | |
| Majority | 951 | 16.2 | +7.0 | ||
| Turnout | 5,837 | 70.4 | −9.5 | ||
| Registered electors | 8,297 | ||||
| Conservative hold | Swing | +3.5 | |||
Elections in the 1890s
| Party | Candidate | Votes | % | ±% | |
|---|---|---|---|---|---|
| Liberal | Frederick Frye | 3,503 | 51.5 | +9.6 | |
| Conservative | William Edward Thompson Sharpe | 3,293 | 48.5 | −9.6 | |
| Majority | 210 | 3.0 | N/A | ||
| Turnout | 6,796 | 75.4 | +5.0 | ||
| Registered electors | 9,017 | ||||
| Liberal gain from Conservative | Swing | +9.6 | |||
| Party | Candidate | Votes | % | ±% | |
|---|---|---|---|---|---|
| Conservative | William Edward Thompson Sharpe | 3,829 | 56.8 | +8.3 | |
| Liberal | Frederick Frye | 2,913 | 43.2 | −8.3 | |
| Majority | 916 | 13.6 | N/A | ||
| Turnout | 6,742 | 71.1 | −4.3 | ||
| Registered electors | 9,482 | ||||
| Conservative gain from Liberal | Swing | +8.3 | |||
Elections in the 1900s
| Party | Candidate | Votes | % | ±% | |
|---|---|---|---|---|---|
| Conservative | William Edward Thompson Sharpe | 3,257 | 56.3 | −0.5 | |
| Liberal | Rufus Isaacs | 2,527 | 43.7 | +0.5 | |
| Majority | 730 | 12.6 | −1.0 | ||
| Turnout | 5,784 | 62.0 | −9.1 | ||
| Registered electors | 9,323 | ||||
| Conservative hold | Swing | −0.5 | |||

Stanger
| Party | Candidate | Votes | % | ±% | |
|---|---|---|---|---|---|
| Liberal | Henry Yorke Stanger | 4,416 | 56.8 | +13.1 | |
| Conservative | Ellis Hume-Williams | 3,358 | 43.2 | −13.1 | |
| Majority | 1,058 | 13.6 | N/A | ||
| Turnout | 7,774 | 75.7 | +13.7 | ||
| Registered electors | 10,270 | ||||
| Liberal gain from Conservative | Swing | +13.1 | |||
Elections in the 1910s
| Party | Candidate | Votes | % | ±% | |
|---|---|---|---|---|---|
| Conservative | Alan Burgoyne | 4,611 | 53.1 | +9.9 | |
| Liberal | Henry Robson | 4079 | 46.9 | -9.9 | |
| Majority | 532 | 6.2 | N/A | ||
| Turnout | 10,100 | 86.0 | +10.3 | ||
| Conservative gain from Liberal | Swing | ||||
| Party | Candidate | Votes | % | ±% | |
|---|---|---|---|---|---|
| Conservative | Alan Burgoyne | 4,223 | 54.7 | 1.6 | |
| Liberal | Frank Murray Carson | 3494 | 45.3 | -1.6 | |
| Majority | 729 | 9.4 | +3.2 | ||
| Turnout | 10,100 | 76.4 | -9.6 | ||
| Conservative hold | Swing | ||||
| Party | Candidate | Votes | % | ±% | |
|---|---|---|---|---|---|
| C | Unionist | Alan Burgoyne | 13,176 | 78.3 | +23.6 |
| Labour | William Joseph Jarrett | 3,653 | 21.7 | New | |
| Majority | 9,523 | 56.6 | +11.2 | ||
| Turnout | 38,045 | 44.2 | -32.2 | ||
| Unionist hold | Swing | ||||
| C indicates candidate endorsed by the coalition government. | |||||
Election in the 1920s
| Party | Candidate | Votes | % | ±% | |
|---|---|---|---|---|---|
| Unionist | Percy George Gates | 12,328 | 53.1 | -25.2 | |
| Labour | William Joseph Jarrett | 6,225 | 26.8 | +5.1 | |
| Liberal | Charles William Hayward | 4,666 | 20.1 | New | |
| Majority | 6,103 | 26.3 | -30.3 | ||
| Turnout | 42,328 | 54.9 | +10.7 | ||
| Unionist hold | Swing | -15.2 | |||
| Party | Candidate | Votes | % | ±% | |
|---|---|---|---|---|---|
| Unionist | Percy George Gates | 9,458 | 39.4 | -13.7 | |
| Labour | William Joseph Jarrett | 8,888 | 37.0 | +10.2 | |
| Liberal | Leonard Stein | 5,672 | 23.6 | +3.5 | |
| Majority | 570 | 2.4 | -23.9 | ||
| Turnout | 43,050 | 55.8 | +0.9 | ||
| Unionist hold | Swing | -12.0 | |||
| Party | Candidate | Votes | % | ±% | |
|---|---|---|---|---|---|
| Conservative | Percy George Gates | 16,255 | 53.0 | +13.6 | |
| Labour | Fielding West | 14,401 | 47.0 | +10.0 | |
| Majority | 1,854 | 6.0 | +3.6 | ||
| Turnout | 44,015 | 69.6 | +13.8 | ||
| Conservative hold | Swing | +3.6 | |||
| Party | Candidate | Votes | % | ±% | |
|---|---|---|---|---|---|
| Labour | Fielding West | 19,701 | 48.4 | +1.4 | |
| Unionist | Percy George Gates | 15,511 | 38.1 | -14.9 | |
| Liberal | Frances Stewart | 5,516 | 13.5 | New | |
| Majority | 4,190 | 10.3 | N/A | ||
| Turnout | 59,500 | 68.5 | -1.1 | ||
| Labour gain from Unionist | Swing | +8.1 | |||
Election in the 1930s
| Party | Candidate | Votes | % | ±% | |
|---|---|---|---|---|---|
| Conservative | James Duncan | 27,860 | 63.7 | +25.6 | |
| Labour | Fielding West | 15,843 | 36.3 | -12.1 | |
| Majority | 12,017 | 27.4 | N/A | ||
| Turnout | 60,821 | 71.9 | +3.4 | ||
| Conservative gain from Labour | Swing | +18.8 | |||
| Party | Candidate | Votes | % | ±% | |
|---|---|---|---|---|---|
| Conservative | James Duncan | 18,907 | 53.2 | -10.5 | |
| Labour | Frank Carter | 15,309 | 43.1 | +6.8 | |
| Liberal | John Seymour Spon | 1,323 | 3.7 | New | |
| Majority | 3,598 | 10.1 | -17.3 | ||
| Turnout | 58,691 | 60.6 | -11.3 | ||
| Conservative hold | Swing | -8.7 | |||
Election in the 1940s
| Party | Candidate | Votes | % | ±% | |
|---|---|---|---|---|---|
| Labour | George Rogers | 16,838 | 56.6 | +13.5 | |
| Conservative | James Duncan | 10,699 | 36.0 | -17.2 | |
| Liberal | John Richard Colclough | 2,212 | 7.4 | +3.7 | |
| Majority | 6,139 | 20.6 | N/A | ||
| Turnout | 42,365 | 70.2 | +9.6 | ||
| Labour gain from Conservative | Swing | +15.4 | |||
Elections in the 1950s
| Party | Candidate | Votes | % | ±% | |
|---|---|---|---|---|---|
| Labour | George Rogers | 21,615 | 50.65 | ||
| Conservative | Leonard Caplan[3] | 17,991 | 42.15 | ||
| Liberal | Robert Rufus Carey Evans | 2,522 | 5.91 | ||
| Communist | M.J. Eyre | 551 | 1.29 | New | |
| Majority | 3,624 | 8.50 | |||
| Turnout | 54,480 | 78.34 | |||
| Labour hold | Swing | ||||
| Party | Candidate | Votes | % | ±% | |
|---|---|---|---|---|---|
| Labour | George Rogers | 22,686 | 52.99 | ||
| Conservative | Leonard Caplan[3] | 18,543 | 43.31 | ||
| Liberal | Anthony Graeme Gamble | 1,583 | 3.70 | ||
| Majority | 4,143 | 9.68 | |||
| Turnout | 54,083 | 79.16 | |||
| Labour hold | Swing | ||||
| Party | Candidate | Votes | % | ±% | |
|---|---|---|---|---|---|
| Labour | George Rogers | 20,226 | 53.92 | ||
| Conservative | Robert Bulbrook | 17,283 | 46.08 | ||
| Majority | 2,943 | 7.84 | |||
| Turnout | 53,789 | 69.73 | |||
| Labour hold | Swing | ||||
| Party | Candidate | Votes | % | ±% | |
|---|---|---|---|---|---|
| Labour | George Rogers | 14,925 | 42.75 | −11.17 | |
| Conservative | Robert Bulbrook | 14,048 | 40.24 | −5.84 | |
| Liberal | Michael Louis Hydleman | 3,118 | 8.93 | New | |
| Union Movement | Oswald Mosley | 2,821 | 8.08 | New | |
| Majority | 877 | 2.51 | −5.33 | ||
| Turnout | 34,912 | 67.83 | −1.90 | ||
| Labour hold | Swing | −2.7 | |||
Elections in the 1960s
| Party | Candidate | Votes | % | ±% | |
|---|---|---|---|---|---|
| Labour | George Rogers | 15,283 | 49.50 | ||
| Conservative | Andrew Bowden | 12,771 | 41.37 | ||
| Liberal | Yvonne C Richardson | 2,819 | 9.13 | ||
| Majority | 2,512 | 8.13 | |||
| Turnout | 30,873 | 61.32 | |||
| Labour hold | Swing | ||||
| Party | Candidate | Votes | % | ±% | |
|---|---|---|---|---|---|
| Labour | George Rogers | 16,012 | 54.79 | ||
| Conservative | Leon Brittan | 10,749 | 36.78 | ||
| Liberal | Anthony Clive S Thomas | 2,462 | 8.42 | ||
| Majority | 5,263 | 18.01 | |||
| Turnout | 29,223 | 62.07 | |||
| Labour hold | Swing | ||||
Election in the 1970s
| Party | Candidate | Votes | % | ±% | |
|---|---|---|---|---|---|
| Labour | Bruce Douglas-Mann | 13,175 | 52.8 | -2.0 | |
| Conservative | Leon Brittan | 9,792 | 39.2 | +2.4 | |
| Liberal | Patrick Spencer | 1,990 | 7.9 | -0.5 | |
| Majority | 3,383 | 13.6 | -4.4 | ||
| Turnout | 24,957 | 57.4 | -4.7 | ||
| Labour hold | Swing | ||||
References
- Craig, FWS, ed. (1974). British Parliamentary Election Results: 1885-1918. London: Macmillan Press. ISBN 9781349022984.
- British parliamentary election results 1918-1949, Craig, F.W.S.
- "Obituary: Leonard Caplan". The Daily Telegraph. 8 February 2001. Retrieved 19 March 2014.
- "UK General Election results, 1959". Archived from the original on 11 August 2011. Retrieved 31 January 2019.
- "General Election Results Suppplement". The Times. 20 June 1970. p. ix.
- Leigh Rayment's Historical List of MPs – Constituencies beginning with "K" (part 1)
- British Parliamentary Election Results 1885-1918, compiled and edited by F.W.S. Craig (Macmillan Press 1974)
- Debrett’s Illustrated Heraldic and Biographical House of Commons and the Judicial Bench 1886
- Debrett’s House of Commons and the Judicial Bench 1901
- Debrett’s House of Commons and the Judicial Bench 1918
This article is issued from Wikipedia. The text is licensed under Creative Commons - Attribution - Sharealike. Additional terms may apply for the media files.
