KAlgebra
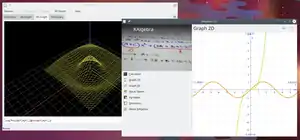
KAlgebra is a mathematical graph calculator included in the KDE education package. While it is based on the MathML content markup language, knowledge of MathML is not required for use. The calculator includes numerical, logical, symbolic, and analytical functions, and can plot the results onto a 2D or 3D graph. KAlgebra is free and open source software, licensed under the GNU Public License.
 Screenshot of KAlgebra showing 2D plotting | |
| Developer(s) | KDE |
|---|---|
| Initial release | 2005 |
| Stable release | 20.04.2[1]
/ 11 June 2020 |
| Repository | |
| Written in | C++ (Qt) |
| Type | Educational, mathematical, graphing calculator |
| License | GPL |
| Website | apps |
KAlgebra has been mentioned by various media sources as free / open source educational programs.[2][3]
User interface and syntax

KAlgebra uses an intuitive algebraic syntax, similar to those used on modern graphing calculators. User-entered expressions are converted to MathML in the background, or they can be entered directly. The program is divided into four views, Console, 2D Graph, 3D Graph, and Dictionary. A series of calculations can be performed with user-defined scripts, which are macros that can be reused and shared.
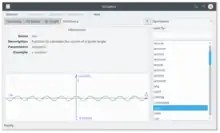
The dictionary includes a comprehensive list of all built-in functions in KAlgebra. Functions can be looked up with parameters, examples, formulas and sample plots. Over 100 functions and operations are currently supported.
Graphing and dictionary

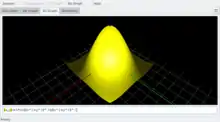
In the 2D and 3D graph views, functions can evaluated and plotted. Currently KAlgebra only supports 3D graphs explicitly dependent only on the x and y. Both views support defining the viewpoint. The user can hover their cursor over a line and find the exact X and Y values for 2D graphs, as well as create a live tangent line.
In the 3D view, the user can control the viewpoint position with the keyboard's arrow keys, and zooming in and out is done with the W and S keys respectively. The user can also draw lines and make dots on the 3D graph and export the graph in various formats.
References
- "Release 20.04.2". 11 June 2020. Retrieved 16 June 2020.
- "Hebat, Kabupaten Kendal Rilis OS Lokal".
- "KDE SC 4.4 Beta1 veröffentlicht".
