JMP (statistical software)
JMP (pronounced "jump") is a suite of computer programs for statistical analysis developed by the JMP business unit of SAS Institute. It was launched in 1989[1] to take advantage of the graphical user interface introduced by the Macintosh. It has since been significantly rewritten and made available for the Windows operating system. JMP is used in applications such as Six Sigma, quality control, and engineering, design of experiments, as well as for research in science, engineering, and social sciences.
 | |
| Developer(s) | SAS Institute |
|---|---|
| Stable release | Version 15
/ October 2019 |
| Operating system | Windows, Macintosh |
| Type | Statistical package, visualization, multivariate analysis, genomics, biomarkers, clinical |
| License | Proprietary |
| Website | jmp |
The software can be purchased in any of five configurations: JMP, JMP Pro, JMP Clinical, JMP Genomics and the JMP Graph Builder App for the iPad. JMP can be automated with its proprietary scripting language, JSL. The software is focused on exploratory visual analytics, where users investigate and explore data. These explorations can also be verified by hypothesis testing, data mining, or other analytic methods. In addition, discoveries made through graphical exploration can lead to a designed experiment that can be both designed and analyzed with JMP.
History

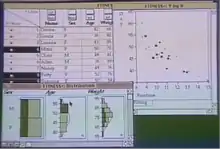
JMP was developed in the mid- to late-1980s by John Sall and a team of developers to make use of the graphical user interface introduced by the Apple Macintosh.[2] It originally stood for "John's Macintosh Project"[3][4] and was first released in October 1989.[2] It was used mostly by scientists and engineers for design of experiments (DOE), quality and productivity support (Six Sigma), and reliability modeling.[5] Semiconductor manufacturers were also among JMP's early adopters.[6]
Interactive graphics and other features were added in 1991[7][8] with version 2.0. Version 2 was twice the size as the original, though it was still delivered on a floppy disk. It required 2 MB of memory and came with 700 pages of documentation.[9] Support for Microsoft Windows was added with version 3.1 in 1994.[4][10] Rewritten with Version 4 and released in 2002, JMP could import data from a wider variety of data sources[11] and added support for surface plots.[8] Version 4 also added time series forecasting and new smoothing models, such as the seasonal smoothing method, called Winter's Method, and ARIMA (Autoregressive Integrated Moving Average). It was also the first version to support JSL, JMP Scripting Language.[12]
In 2005, data mining tools like a decision tree and neural net were added with version 5[13] as well as Linux support, which was later withdrawn in JMP 9.[5] Later in 2005, JMP 6 was introduced.[6][14] JMP began integrating with SAS in version 7.0 in 2007 and has strengthened this integration ever since. Users can write SAS code in JMP, connect to SAS servers, and retrieve and use data from SAS. Support for bubble plots was added in version 7.[5][15] JMP 7 also improved data visualization and diagnostics.[16]
JMP 8 was released in 2009 with new drag-and-drop features and a 64-bit version to take advantage of advances in the Mac operating system.[17] It also added a new user interface for building graphs, tools for choice experiments and support for Life Distributions.[18] According to Scientific Computing, the software had improvements in "graphics, QA, ease-of-use, SAS integration and data management areas."[19] JMP 9 in 2010 added a new interface for using the R programming language from JMP and an add-in for Excel.[20][21] The main screen was rebuilt and enhancements were made to simulations, graphics and a new Degradation platform.[22] In March 2012, version 10 made improvements in data mining, predictive analytics, and automated model building.[23][24]
Version 11 was released in late 2014. It included new ease-of-use features, an Excel import wizard, and advanced features for design of experiments.[25] Two years later, version 12.0 was introduced. According to Scientific Computing, it added a new "Modeling Utilities" submenu of tools, performance improvements and new technical features for statistical analysis.[26] Version 13.0 was released in September 2016 and introduced various improvements to reporting, ease-of-use and its handling of large data sets in memory.[27][28]
Software

JMP consists of JMP, JMP Pro, JMP Clinical and JMP Genomics,[24] as well as the Graph Builder iPad App.[29] JMP Clinical and JMP Genomics combine JMP with SAS software.[24]
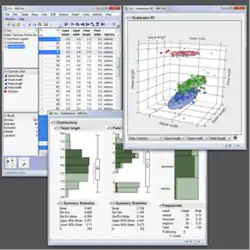
JMP software is partly focused on exploratory data analysis and visualization. It is designed for users to investigate data to learn something unexpected, as opposed to confirming a hypothesis.[4][24][30] JMP links statistical data to graphics representing them, so users can drill down or up to explore the data and various visual representations of it.[11][31][32] Its primary applications are for designed experiments and analyzing statistical data from industrial processes.[6]
JMP is a desktop application with a wizard-based user interface, while SAS can be installed on servers. It runs in-memory, instead of on disk storage.[24] According to a review in Pharmaceutical Statistics, JMP is often used as a graphical front-end for a SAS system, which performs the statistical analysis and tabulations.[33] JMP Genomics, used for analyzing and visualizing genomics data,[34] requires a SAS component to operate and can access SAS/Genetics and SAS/STAT procedures or invoke SAS macros.[33] JMP Clinical, used for analyzing clinical trial data, can package SAS code within the JSL scripting language and convert SAS code to JMP.[15]
JMP is also the name of the SAS Institute business unit that develops JMP. As of 2011 it had 180 employees and 250,000 users.[24]
JMP Scripting Language (JSL)
The JMP Scripting Language (JSL) is an interpreted language for recreating analytic results and for automating or extending the functionality of JMP software.[35]:29 JSL was first introduced in JMP version 4 in 2000.[36]:1 JSL has a LISP-like syntax, structured as a series of expressions. All programming elements, including if-then statements and loops, are implemented as JSL functions. Data tables, display elements and analyses are represented by objects in JSL that are manipulated with named messages. Users may write JSL scripts to perform analyses and visualizations not available in the point-and-click interface or to automate a series of commands, such as weekly reports.[35] SAS, Python, R, and Matlab code can also be executed using JSL.[37]
Notable applications

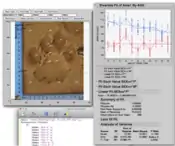
In 2007, a wildlife monitoring organization, WildTrack, started using JMP with the Footprint Identification Technology (FIT) system to identify individual endangered animals by their footprints.[38] In 2009, the Chicago Botanic Garden used JMP to analyze DNA data from tropical breadfruit. Researchers determined that the seedless, starchy fruit was created by the deliberate hybridization of two fruits, the breadnut and the dugdug.[39] The Herzenberg Laboratory at Stanford has integrated JMP with the Fluorescence Activated Cell Sorter (FACS). The FACS system is used to study HIV, cancer, stem-cells and oceanography.[40]
See also
References
- SAS Institute Inc. "About JMP". Retrieved 2 July 2016.
- Ian Cox; Marie A. Gaudard; Philip J. Ramsey; Mia L. Stephens; Leo Wright (21 December 2009). Visual Six Sigma: Making Data Analysis Lean. John Wiley & Sons. pp. 23–. ISBN 978-0-470-50691-2. Retrieved 16 November 2012.
- Billionaire SAS co-founder keeps on coding
- Shipp, Charles (2012). "Proficiency in JMP®Visualization" (PDF). Retrieved November 27, 2013.
- Okerson, Barbara, JMPing In: A SAS Programmer's Look at JMP (PDF), SESUG 2011, retrieved December 30, 2012CS1 maint: location (link)
- Collins, John (September 23, 2005). "Software Innovator helps companies get the facts straight". The Irish Times. p. 8.
- APICS, the Performance Advantage. American Production and Inventory Control Society. 1991. Retrieved 30 December 2012.
- Goodman, Arnold (January 24, 2012). "JCGS@20, Visual@40, Interface@45 & !!Challenges!!". Journal of Computational and Graphical Statistics. 20 (4): 818–829. doi:10.1198/jcgs.2011.204c.
- Kim, Ki (1992). "JMP, Version 2. Software for Statistical Visualization on the Apple Macintosh". Journal of Chemical Information and Modeling. 32 (2): 174–175. doi:10.1021/ci00006a600. ISSN 1549-9596.
- John P. Sall, Northern Illinois University, archived from the original on December 5, 2012, retrieved November 16, 2012
- Altman, Micah (2002). "A Review of JMP 4.03 With Special Attention to its Numerical Accuracy". The American Statistician. 56 (1): 72–75. doi:10.1198/000313002753631402. ISSN 0003-1305.
- Gjertsen, Bill, Using JMP Version 4 for Time Series Analysis (PDF), North Carolina State University, retrieved December 30, 2012
- "What Is A Data Mining Product?". Information Management.
- Sall, John, JMP Version 6 Featuring Split Plots (PDF), SUGI 30, retrieved December 30, 2012CS1 maint: location (link)
- Huisden, Robert (2011), JMP Clinical for the Exploration of Legacy Studies (PDF), retrieved December 30, 2012
- Wass, John. "JMP7: One of the best just got better". Scientific Computing. Retrieved May 9, 2012.
- "Launches SAS JMP 8 for Mac and Linux". Ti Journal. April 11, 2009. Retrieved December 30, 2012.
- "Introducing JMP Version 8" (PDF), A Technical Publication for JMP Users, JMPer Cable (25), Winter 2009, retrieved December 30, 2012
- Wass, John. "JMP 8: Continuous Improvement". Scientific Computing. Retrieved November 16, 2012.
- New Features in JMP 9 (PDF), JMP, retrieved December 30, 2012
- Bridgewater, Adrian (November 3, 2010). "JMP Genomics 5: Data Visualization & Exploration". Dr. Dobb's Journal. Retrieved May 31, 2012.
- Wass, John. "JMP 9: A really new version". Scientific Computing. Archived from the original on September 14, 2011. Retrieved May 9, 2012.
- Shipp, Charles; Lafler, Kirk Paul, "Proficiency in JMP Visualization" (PDF), PharmaSUG 2012, retrieved December 30, 2012
- Taylor, James (August 10, 2011). "First Look – JMP Pro". JTonEDM. Retrieved May 31, 2012.
- Wass, John (November 7, 2014). "JMP 11: Remarkable Statistics, Graphics and Integration". Scientific Computing. Retrieved May 11, 2016.
- Wass, John (January 27, 2016). "JMP Pro 12: The Best Keeps Getting Better!". Scientific Computing. Retrieved May 11, 2016.
- on (November 10, 2016). "First Look: SAS JMP 13 and JMP Pro 13". JT on EDM — James Taylor on Everything Decision Management. Retrieved November 28, 2016.
- Report, Impact; Roy, Krishna. "SAS JMP gets self-service data and text prep and analysis makeover". 451 Research. Retrieved November 28, 2016.
- JMP Graph Builder for iPad, SAS Institute, retrieved December 30, 2012
- "SAS JMP 8 for the Macintosh review". Macstats. Retrieved November 19, 2012.
- Jones, B.; Sall, J. (2011). "JMP statistical discovery software". Wiley Interdisciplinary Reviews: Computational Statistics. 3 (3): 188–194. doi:10.1002/wics.162.
- Robert H. Carver (30 July 2010). Practical Data Analysis with Jmp. SAS Institute. pp. 61–. ISBN 978-1-60764-475-0. Retrieved 16 November 2012.
- Lovell, David P. (2011). "Review of JMP genomics". Pharmaceutical Statistics. 10 (4): 384–392. doi:10.1002/pst.460. ISSN 1539-1604.
- Zhang, Qingyu; Richard S. Segall. "Commercial Data Mining Software". Computational Statistics. doi:10.1007/978-0-387-09823-4_65.
- SAS Publishing (1 March 2012). Jmp 10 Scripting Guide. SAS Institute. ISBN 978-1-61290-195-4. Retrieved 13 December 2012.
- Wendy Murphrey; Rosemary Lucas (26 August 2009). Jump Into Jmp Scripting. SAS Institute. ISBN 978-1-59994-658-0. Retrieved 14 December 2012.
- Publishing SAS Publishing; SAS Institute (December 11, 2009). JMP Release 8 User Guide. SAS Institute. pp. 392–. ISBN 978-1-60764-301-2. Retrieved 13 December 2012.
- Hayes Weier, Mary (June 25, 2007). "Scientists use BI Software and Intuit Trackers to Gauge Polar Bear Populations". InformationWeek. Archived from the original on January 26, 2013. Retrieved May 25, 2012.
- Lai, Eric (September 18, 2009). "Billionaire SAS co-founder keeps on coding". Computerworld. Retrieved May 13, 2016.
- "Advancements in FACS System for Clinical Studies". The Computerworld Honors Program. Archived from the original on November 5, 2011. Retrieved December 15, 2011.
Further reading
- Holland, Wayne (February 1, 2007), JMP 6.0.3: interactive exploratory data and statistical analysis tool meets the statistical needs of virtually any user., Operations Research Management Science Today