GemIdent
GemIdent is an interactive image recognition program that identifies regions of interest in images and photographs. It is specifically designed for images with few colors, where the objects of interest look alike with small variation. For example, color image segmentation of:
- Oranges from a tree
- Stained cells from microscopic images

GemIdent also packages data analysis tools to investigate spatial relationships among the objects identified.
History
GemIdent was developed at Stanford University by Adam Kapelner from June, 2006 until January, 2007 in the lab of Dr. Peter Lee under the tutelage of Professor Susan Holmes.[1] The concept was inspired by data Kohrt et al.[2] who analyzed immune profiles of lymph nodes in breast cancer patients. Hence, GemIdent works well when identifying cells in IHC-stained tissue imaged via automated light microscopy when the nuclear background stain and membrane/cytoplasmic stain are well-defined. In 2008, it was adapted to support multispectral imaging techniques.[3]
Methodology
GemIdent uses supervised learning to perform automated identification of regions of interest in the images. Therefore, the user must do a substantial amount of work first supplying the relevant colors, then pointing out examples of the objects or regions themselves as well as negatives (training set creation).
When a user clicks on a pixel, many scores are generated using the surrounding color information via Mahalanobis Ring Score attribute generation (read the JSS paper for a detailed exposition). These scores are then used to build a random forest machine-learning classifier which will then classify pixels in any given image.
After classification, there may be mistakes. The user can return to training and point out the specific mistakes and then reclassify. These training-classifying-retraining-reclassifying iterations (considered interactive boosting) can result in a highly accurate segmentation.
Recent applications
In 2010, Setiadi et al.[4] analyzed histological sections of lymph nodes looking at spatial densities of B and T cells. "Cell numbers do not capture the full range of information encoded within tissues".
Source code
The Java source code is now open source under GPL2.[5]
Examples

The raw photograph (left), a superimposed mask showing the pixel classification results (center), and finally the photograph is marked with the centroids of the object of interest - the oranges (right)

The raw microscopic image of a stained lymph node (left) from the Kohrt study,[2] a superimposed mask showing the pixel classification results (center), and finally the image is marked with the centroids of the object of interest - the cancer nuclei (right)

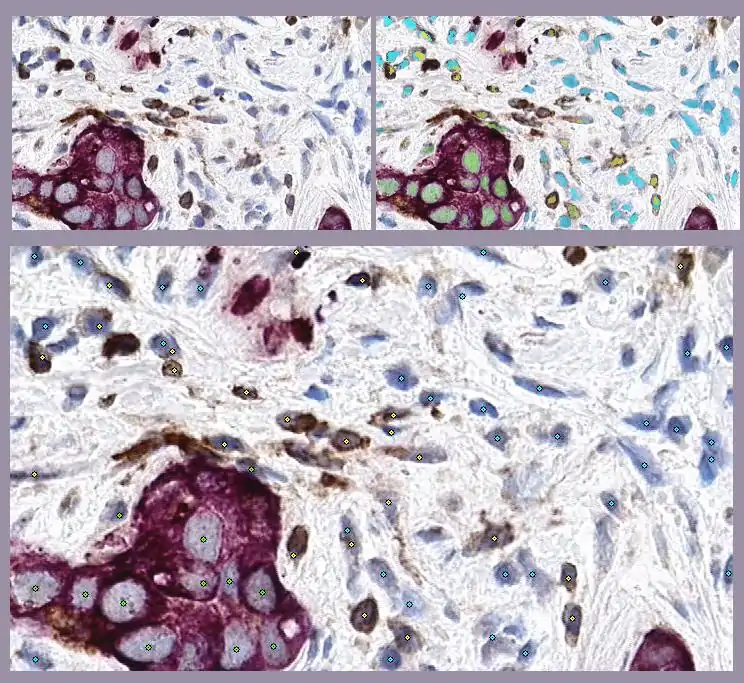
This example illustrates GemIdent's ability to find multiple phenotypes in the same image: the raw microscopic image of a stained lymph node (top left) from the Kohrt study,[2] a superimposed mask showing the pixel classification results (top right), and finally the image marked with the centroids of the objects of interest - the cancer nuclei (in green stars), the T-cells (in yellow stars), and non-specific background nuclei (in cyan stars).

The command-line data analysis and visualization interface in action analyzing results of a classification of a lymph node from the Kohrt study.[2] The histogram displays the distribution of distances from T-cells to neighboring cancer cells. The binary image of cancer membrane is the result of a pixel-only classification. The open PDF document is the autogenerated report of the analysis which includes a thumbnail view of the entire lymph node, counts and Type I error rates for all phenotypes, as well as a transcript of the analyses performed.
References
- Kapelner, Adam; Peter P. Lee; Susan Holmes (July 2007). "An Interactive Statistical Image Segmentation and Visualization System". Medivis. IEEE Computer Society. 0: 81–86. doi:10.1109/MEDIVIS.2007.5. ISBN 0-7695-2904-6. Archived from the original on 2013-04-15.
- Kohrt, Holbrook E; Navid Nouri; Kent Nowels; Denise Johnson; Susan Holmes; Peter P Lee (September 2005). "Profile of Immune Cells in Axillary Lymph Nodes Predicts Disease-Free Survival in Breast Cancer". PLOS Medicine. 2 (9): e284. doi:10.1371/journal.pmed.0020284. ISSN 1549-1676. PMC 1198041. PMID 16124834.
- Holmes, Susan; Adam Kapelner; Peter P. Lee (January 15, 2009). "An Interactive Java Statistical Image Segmentation System: GemIdent". Journal of Statistical Software. 30 (10): 1–20. ISSN 1548-7660.
- Setiadi, Francesca; Nelson C. Ray; Holbrook E. Kohrt; Adam Kapelner; Valeria Carcamo-Cavazos; Edina B. Levic; Sina Yadegarynia; Chris M. van der Loos; Erich J. Schwartz; Susan Holmes; Peter P. Lee (Aug 25, 2010). "Quantitative, Architectural Analysis of Immune Cell Subsets in Tumor-Draining Lymph Nodes from Breast Cancer Patients and Healthy Lymph Nodes". PLoS ONE. 5 (8): 1–20. doi:10.1371/journal.pone.0012420. PMC 2928294. PMID 20811638.
- https://github.com/kapelner/GemIdent