2011 Oldham Metropolitan Borough Council election
Elections to Oldham Council were held on 5 May 2011. One third of the council was up for election.
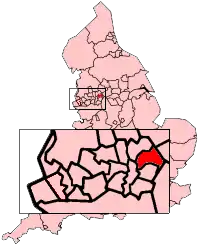
The Metropolitan Borough of Oldham shown within England.
Labour gained overall control of the Council.
After the election, the composition of the council was
- Labour 34
- Liberal Democrat 21
- Conservative 5
Election result
| Party | Seats | Gains | Losses | Net gain/loss | Seats % | Votes % | Votes | +/− | |
|---|---|---|---|---|---|---|---|---|---|
| Labour | 16 | 7 | 0 | +7 | 52.7 | 32,778 | +14.4 | ||
| Liberal Democrats | 3 | 0 | 6 | -6 | 23.4 | 14,538 | -7.1 | ||
| Conservative | 1 | 1 | 2 | -1 | 19.2 | 11,955 | -6.3 | ||
| Independent | 0 | 0 | 0 | 3.7 | 2,286 | -0.6 | |||
| Green | 0 | 0 | 0 | 0.9 | 586 | +0.9 | |||
Ward results
Alexandra ward
| Party | Candidate | Votes | % | ±% | |
|---|---|---|---|---|---|
| Labour | Jenny Harrison | 1,586 | 59.5 | +25.1 | |
| Conservative | Raja Iqbal | 625 | 23.4 | -0.3 | |
| Liberal Democrats | Aftab Hussain | 455 | 17.1 | -3.9 | |
| Majority | 961 | 36.0 | +25.4 | ||
| Turnout | 2,666 | ||||
| Labour hold | Swing | ||||
Chadderton Central ward
| Party | Candidate | Votes | % | ±% | |
|---|---|---|---|---|---|
| Labour | Eddie Moores | 1,679 | 59.4 | +8.8 | |
| Conservative | Eileen Hulme | 1,009 | 35.7 | +5.5 | |
| Liberal Democrats | Pat Lord | 139 | 4.9 | -13.0 | |
| Majority | 670 | 23.7 | +3.4 | ||
| Turnout | 2,827 | ||||
| Labour gain from Conservative | Swing | ||||
Chadderton North ward
| Party | Candidate | Votes | % | ±% | |
|---|---|---|---|---|---|
| Labour | Dave Houle | 1,876 | 58.6 | +15.4 | |
| Conservative | Lewis Quigg | 1,143 | 35.7 | -2.2 | |
| Liberal Democrats | Keith Taylor | 181 | 5.7 | -10.0 | |
| Majority | 733 | 22.9 | +17.6 | ||
| Turnout | 3,200 | ||||
| Labour gain from Conservative | Swing | ||||
Chadderton South ward
| Party | Candidate | Votes | % | ±% | |
|---|---|---|---|---|---|
| Labour | Graham Shuttleworth | 1,664 | 68.7 | +16.6 | |
| Conservative | Kenneth Heeks | 656 | 27.1 | -6.2 | |
| Liberal Democrats | Fazal Rahim | 101 | 4.2 | -9.5 | |
| Majority | 1,008 | 41.6 | +21.8 | ||
| Turnout | 2,421 | ||||
| Labour hold | Swing | ||||
Coldhurst ward
| Party | Candidate | Votes | % | ±% | |
|---|---|---|---|---|---|
| Labour | Montaz Azad | 2,897 | 60.7 | +10.8 | |
| Liberal Democrats | Jilad Miah | 1,661 | 34.6 | -4.5 | |
| Conservative | Muhammed Dara | 226 | 4.7 | -6.3 | |
| Majority | 1,236 | 25.8 | +15.0 | ||
| Turnout | 4,784 | ||||
| Labour gain from Liberal Democrats | Swing | ||||
Crompton ward
| Party | Candidate | Votes | % | ±% | |
|---|---|---|---|---|---|
| Liberal Democrats | John Dillon | 1,261 | 40.2 | -4.5 | |
| Labour | Ken Rustidge | 1,050 | 33.5 | +13.4 | |
| Conservative | David Dunning | 828 | 26.4 | +0.7 | |
| Majority | 211 | 6.7 | -12.3 | ||
| Turnout | 3,139 | ||||
| Liberal Democrats hold | Swing | ||||
Failsworth East ward
| Party | Candidate | Votes | % | ±% | |
|---|---|---|---|---|---|
| Labour | Jim McMahon | 1,925 | 70.7 | +17.8 | |
| Conservative | Robert Barnes | 674 | 24.8 | -5.7 | |
| Liberal Democrats | Stephen Barrow | 124 | 4.6 | -7.0 | |
| Majority | 1,251 | 45.9 | +23.6 | ||
| Turnout | 2,723 | ||||
| Labour hold | Swing | ||||
Failsworth West ward
| Party | Candidate | Votes | % | ±% | |
|---|---|---|---|---|---|
| Labour | Glenys Butterworth | 1,532 | 58.2 | +12.9 | |
| Independent | Warren Bates | 669 | 25.4 | +11.3 | |
| Liberal Democrats | Ron Wise | 245 | 9.3 | -3.1 | |
| Conservative | Miranda Meadowcroft | 185 | 7.0 | -22.2 | |
| Majority | 863 | 32.8 | +15.7 | ||
| Turnout | 2,631 | ||||
| Labour hold | Swing | ||||
Hollinwood ward
| Party | Candidate | Votes | % | ±% | |
|---|---|---|---|---|---|
| Labour | Steve Williams | 1,394 | 60.7 | +16.9 | |
| Liberal Democrats | Keith Pendlebury | 563 | 24.5 | -9.5 | |
| Independent | John Berry | 339 | 14.8 | +7.7 | |
| Majority | 831 | 36.2 | +26.3 | ||
| Turnout | 2,296 | ||||
| Labour gain from Liberal Democrats | Swing | ||||
Medlock Vale ward
| Party | Candidate | Votes | % | ±% | |
|---|---|---|---|---|---|
| Labour | Kaiser Rehman | 1,846 | 60.3 | +18.2 | |
| Liberal Democrats | Rafiq Pazeer | 654 | 21.4 | -14.6 | |
| Conservative | Zulfiqar Mohammed | 562 | 18.4 | -0.5 | |
| Majority | 1,210 | 39.5 | +33.4 | ||
| Turnout | 3,062 | ||||
| Labour hold | Swing | ||||
Royton North ward
| Party | Candidate | Votes | % | ±% | |
|---|---|---|---|---|---|
| Labour | Tony Larkin | 1,878 | 60.9 | +12.4 | |
| Conservative | Joseph Farquhar | 962 | 31.2 | -0.9 | |
| Liberal Democrats | Kevin Dawson | 242 | 7.9 | -11.5 | |
| Majority | 916 | 29.7 | +13.4 | ||
| Turnout | 3,082 | ||||
| Labour hold | Swing | ||||
Royton South ward
| Party | Candidate | Votes | % | ±% | |
|---|---|---|---|---|---|
| Labour | Steven Bashforth | 1,932 | 65.2 | +24.3 | |
| Conservative | Allan Fish | 776 | 26.2 | -2.1 | |
| Liberal Democrats | Keith Begley | 257 | 8.7 | -20.9 | |
| Majority | 1,156 | 39.0 | +27.8 | ||
| Turnout | 2,965 | ||||
| Labour hold | Swing | ||||
Saddleworth North ward
| Party | Candidate | Votes | % | ±% | |
|---|---|---|---|---|---|
| Liberal Democrats | Derek Heffernan | 1,100 | 31.0 | -2.9 | |
| Independent | Ken Hulme | 1,083 | 30.6 | +1.2 | |
| Conservative | Phil Sewell | 711 | 20.1 | -2.0 | |
| Labour | Sean Fielding | 650 | 18.3 | +3.6 | |
| Majority | 17 | 0.5 | -4.0 | ||
| Turnout | 3,544 | ||||
| Liberal Democrats hold | Swing | ||||
Saddleworth South ward
| Party | Candidate | Votes | % | ±% | |
|---|---|---|---|---|---|
| Conservative | Graham Sheldon | 1,590 | 42.1 | +0.9 | |
| Liberal Democrats | Phil Renold | 1,094 | 28.9 | -18.1 | |
| Labour | Dilys Fletcher | 695 | 18.4 | +12.6 | |
| Green | Dominic Wall | 401 | 10.6 | +10.6 | |
| Majority | 496 | 13.1 | |||
| Turnout | 3,780 | ||||
| Conservative gain from Liberal Democrats | Swing | ||||
Saddleworth West and Lees ward
| Party | Candidate | Votes | % | ±% | |
|---|---|---|---|---|---|
| Labour | Adrian Alexander | 1,316 | 42.3 | +15.8 | |
| Liberal Democrats | Brian Lord | 1,176 | 37.8 | -10.9 | |
| Conservative | Pam Byrne | 622 | 20.0 | -2.0 | |
| Majority | 140 | 4.5 | |||
| Turnout | 3,114 | ||||
| Labour gain from Liberal Democrats | Swing | ||||
St James ward
| Party | Candidate | Votes | % | ±% | |
|---|---|---|---|---|---|
| Labour | Nigel Newton | 1,155 | 53.0 | +20.1 | |
| Liberal Democrats | Stephen Fairbrother | 777 | 35.7 | -3.7 | |
| Conservative | David Caddick | 246 | 11.3 | -5.9 | |
| Majority | 378 | 17.3 | |||
| Turnout | 2,178 | ||||
| Labour gain from Liberal Democrats | Swing | ||||
St Marys ward
| Party | Candidate | Votes | % | ±% | |
|---|---|---|---|---|---|
| Labour | Shadab Qumer | 2,847 | 65.5 | +16.4 | |
| Liberal Democrats | Ajawat Hussain | 1,255 | 28.9 | -12.4 | |
| Conservative | David Atherton | 244 | 5.6 | -4.0 | |
| Majority | 1,592 | 36.3 | +28.8 | ||
| Turnout | 4,346 | ||||
| Labour hold | Swing | ||||
Shaw ward
| Party | Candidate | Votes | % | ±% | |
|---|---|---|---|---|---|
| Liberal Democrats | Mark Alcock | 1,084 | 40.4 | -7.1 | |
| Labour | Amanda Chadderton | 986 | 36.8 | +15.2 | |
| Conservative | Phelyp Bennet | 612 | 22.8 | -8.1 | |
| Majority | 98 | 3.6 | -13.0 | ||
| Turnout | 2,682 | ||||
| Liberal Democrats hold | Swing | ||||
Waterhead ward
| Party | Candidate | Votes | % | ±% | |
|---|---|---|---|---|---|
| Labour | Peter Dean | 1,340 | 47.8 | +12.7 | |
| Liberal Democrats | Kay Knox | 1,064 | 38.0 | -1.4 | |
| Conservative | Neil Allsopp | 203 | 7.2 | -7.3 | |
| Independent | Stuart Allsopp | 195 | 7.0 | -4.0 | |
| Majority | 276 | 9.8 | |||
| Turnout | 2,802 | ||||
| Labour gain from Liberal Democrats | Swing | ||||
Werneth ward
| Party | Candidate | Votes | % | ±% | |
|---|---|---|---|---|---|
| Labour | Javid Iqbal | 2,530 | 64.7 | +6.2 | |
| Liberal Democrats | Asghar Ali | 1,115 | 28.5 | +17.9 | |
| Conservative | Muhammad Imran | 266 | 6.8 | -22.7 | |
| Majority | 1,415 | 36.2 | +7.2 | ||
| Turnout | 3,911 | ||||
| Labour hold | Swing | ||||
References
| Mayor | |
|---|---|
| Bolton | |
| Bury | |
| Manchester | |
| Oldham | |
| Rochdale | |
| Salford | |
| Stockport | |
| Tameside | |
| Trafford | |
| Wigan | |
| County Council | |
| |
This article is issued from Wikipedia. The text is licensed under Creative Commons - Attribution - Sharealike. Additional terms may apply for the media files.