2010 Plymouth City Council election
The 2010 Plymouth City Council election was held on 6 May 2010 to elect members of Plymouth City Council in England.
| |||||||||||||||||||||||||||||||||||||||||
20 of the 57 seats to Plymouth City Council 29 seats needed for a majority | |||||||||||||||||||||||||||||||||||||||||
|---|---|---|---|---|---|---|---|---|---|---|---|---|---|---|---|---|---|---|---|---|---|---|---|---|---|---|---|---|---|---|---|---|---|---|---|---|---|---|---|---|---|
| |||||||||||||||||||||||||||||||||||||||||
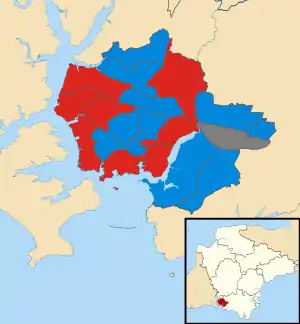 Map showing the results of contested wards in the 2010 Plymouth City Council elections. | |||||||||||||||||||||||||||||||||||||||||
| |||||||||||||||||||||||||||||||||||||||||
The Conservative Party remained in control of the council with a reduced majority.
Background
Plymouth City Council held local elections on 6 May 2010 along with councils across the United Kingdom as part of the 2010 local elections. The council elects its councillors in thirds, with nineteen being up for election every year for three years, with no election in the fourth year.[2][3]
Councillors defending their seats were previously elected in 2006. In that election, twelve Conservative candidates and seven Labour candidates were elected.[4] This election followed a by-election in Ham, which resulted in a Labour hold.[5]
The Conservative Party had control of the council ahead of this election, with 37 councillors and a majority of eight seats.
The Conservatives were defending 12 seats, the Labour Party 6 and the former Labour candidate, Andy Kerswell, was defending his seat in Efford and Lipson as an independent.
If the Labour Party was to regain the majority they held on the council until 2006, they needed to gain 11 seats, which they failed to do, although made two gains (one against a Conservative and the other against Andy Kerswell) despite a national swing against them.
Overall results
| Party | Seats | Gains | Losses | Net gain/loss | Seats % | Votes % | Votes | +/− | |
|---|---|---|---|---|---|---|---|---|---|
| Conservative | 11 | 0 | 1 | 55.0 | 35.4 | 38,972 | |||
| Labour | 9 | 1 | 0 | 45.0 | 29.8 | 32,767 | |||
| Liberal Democrats | 0 | 0 | 0 | 0.0 | 20.9 | 23,031 | |||
| UKIP | 0 | 0 | 0 | 0.0 | 9.8 | 10,792 | |||
| Green | 0 | 0 | 0 | 0.0 | 2.0 | 2,170 | |||
| Independent | 0 | 0 | 0 | 0.0 | 1.8 | 2,024 | |||
| BNP | 0 | 0 | 0 | 0.0 | 0.3 | 312 | New | ||
| Vivamus | 0 | 0 | 0 | 0.0 | 0.0 | 23 | New | ||
| Total | 20 | 110,091 | |||||||
Note: All changes in vote share are in comparison to the corresponding 2006 election.
Seats up for election in 2010
Gains are shown by highlighting in the winning party's colours, comparing them to when these councillors were last up for election in 2006.
| Ward | Previous Councillor (2006)[6] | Previous Party (2006)[6] | Winning Councillor[7] | Winning Party[7] |
|---|---|---|---|---|
| Budshead | Grant Monahan | Conservative | Grant Monahan | Conservative |
| Compton | Ted Fry | Conservative | Ted Fry | Conservative |
| Devonport | William Stevens | Labour Co-operative | William Stevens | Labour Co-operative |
| Drake | Steven Ricketts | Conservative | Steven Ricketts | Conservative |
| Efford and Lipson | Andy Kerswell | Labour Co-operative (later independent) | David Haydon and Pauline Murphy | Labour |
| Eggbuckland | Ian Bowyer | Conservative | Ian Bowyer | Conservative |
| Ham | Ian Gordon | Labour | Ian Gordon | Labour |
| Honicknowle | Pauline Purnell | Labour | Nicky Williams | Labour |
| Moor View | Michael Foster | Conservative | Mike Wright | Labour |
| Peverell | Martin Leaves | Conservative | Martin Leaves | Conservative |
| Plympton Chaddlewood | Glenn Jordan | Conservative | Glenn Jordan | Conservative |
| Plympton St Mary | David James | Conservative | David James | Conservative |
| Plymstock Dunstone | VivienPengelly | Conservative | VivienPengelly | Conservative |
| Plymstock Radford | Wendy Foster | Conservative | Wendy Foster | Conservative |
| St Budeaux | Sally Letcher | Labour | Sally Bowie (née Letcher) | Labour |
| St Peter and The Waterfront | Sue McDonald | Labour | Sue McDonald | Labour |
| Southway | James Kirk | Labour Co-operative | Tom Browne | Conservative |
| Stoke | Jill Dolan | Conservative | Jill Dolan | Conservative |
| Sutton and Mount Gould | Mary Aspinall | Labour Co-operative | Mary Aspinall | Labour Co-operative |
Ward results
Budshead

| Party | Candidate | Votes | % | |
|---|---|---|---|---|
| Conservative | Grant Monahan | 2,077 | 36.2% | |
| Labour | Mike Fox | 2,012 | 35.1% | |
| Liberal Democrats | Mathew Beynon | 1,024 | 17.9% | |
| UKIP | Thelma Dinham | 623 | 10.9% | |
| Majority | 65 | 1.1% | ||
| Turnout | 5,736 | 60.1% | ||
| Conservative hold | ||||
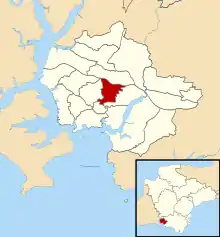
Compton
| Party | Candidate | Votes | % | |
|---|---|---|---|---|
| Conservative | Ted Fry | 2,698 | 41.9% | |
| Liberal Democrats | Steven Smith | 1,560 | 24.2% | |
| Labour | Chaz Singh | 1,358 | 21.1% | |
| UKIP | Michael Cooke | 545 | 8.5% | |
| Green | Josie Bannon | 278 | 4.3% | |
| Majority | 1,138 | 17.7% | ||
| Turnout | 6,439 | 68.2% | ||
| Conservative hold | ||||
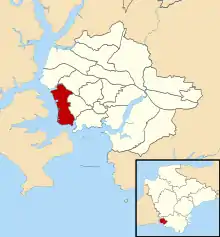
Devonport
| Party | Candidate | Votes | % | |
|---|---|---|---|---|
| Labour | William Stevens | 1,820 | 36.0% | |
| Conservative | Betty Gray | 1,461 | 28.9% | |
| Liberal Democrats | John Brooks | 1,074 | 21.2% | |
| UKIP | Syd Brooks | 573 | 11.3% | |
| Green | Andrew Pratt | 127 | 2.5% | |
| Majority | 359 | 7.1% | ||
| Turnout | 5,055 | 54.0% | ||
| Labour hold | ||||
Drake

| Party | Candidate | Votes | % | |
|---|---|---|---|---|
| Conservative | Steven Ricketts | 984 | 34.6% | |
| Liberal Democrats | Rebecca Trimnell | 832 | 29.2% | |
| Labour | John Smith | 613 | 21.5% | |
| Green | Colin Trier | 170 | 6.0% | |
| UKIP | Michael Ellison | 159 | 5.6% | |
| Independent | Sam Remmer | 89 | 3.1% | |
| Majority | 152 | 5.3% | ||
| Turnout | 2,847 | 55.2% | ||
| Conservative hold | ||||
Efford and Lipson

| Party | Candidate | Votes | % | |
|---|---|---|---|---|
| Labour | David Haydon | 1,950 | ||
| Labour | Pauline Murphy | 1,903 | ||
| Conservative | Andy Ford | 1,387 | ||
| Conservative | Mary Orchard | 1,219 | ||
| Liberal Democrats | Elsie Clark | 1,201 | ||
| Liberal Democrats | Rebecca Tidy | 1,072 | ||
| UKIP | David Salmon | 641 | ||
| Independent | Andy Kerswell | 357 | ||
| Green | Alison Green | 333 | ||
| Independent | Margaret Storer | 110 | ||
| Turnout | 10,173 | 57.8% | ||
| Labour hold | ||||
Eggbuckland

| Party | Candidate | Votes | % | |
|---|---|---|---|---|
| Conservative | Ian Bowyer | 2,691 | 38.7% | |
| Labour | Ken Morrish | 1,969 | 28.3% | |
| Liberal Democrats | Emma Pedlar | 1,256 | 18.1% | |
| UKIP | Roger Thomas | 625 | 9.0% | |
| Independent | Lee Finn | 405 | 5.8% | |
| Majority | 722 | 10.4% | ||
| Turnout | 6,946 | 67.6% | ||
| Conservative hold | ||||
Ham

| Party | Candidate | Votes | % | |
|---|---|---|---|---|
| Labour | Ian Gordon | 2,252 | 40.3% | |
| Conservative | Bethan Roberts | 1,434 | 25.7% | |
| Liberal Democrats | Stewart Campbell | 920 | 16.5% | |
| UKIP | John Read | 717 | 12.8% | |
| Independent | Mark West | 164 | 2.9% | |
| Green | Colin Bannon | 96 | 1.7% | |
| Majority | 818 | 14.7% | ||
| Turnout | 5,583 | 57.8% | ||
| Labour hold | ||||
Honicknowle

| Party | Candidate | Votes | % | |
|---|---|---|---|---|
| Labour | Nicky Williams | 2,407 | 43.2% | |
| Conservative | Paul Rielly | 1,265 | 22.7% | |
| Liberal Democrats | Stephen Goldthorp | 920 | 16.5% | |
| UKIP | Stephen Hoffman | 663 | 11.9% | |
| BNP | Roy Cook | 312 | 5.6% | |
| Majority | 1,142 | 20.5% | ||
| Turnout | 5,567 | 55.4% | ||
| Labour hold | ||||
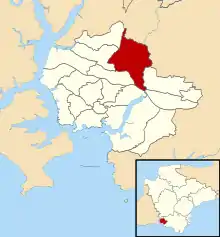
Moor View
| Party | Candidate | Votes | % | |
|---|---|---|---|---|
| Labour | Mike Wright | 2,206 | 36.8% | |
| Conservative | Michael Foster | 1,966 | 32.8% | |
| Liberal Democrats | Andrew Campbell | 1,123 | 18.7% | |
| UKIP | Herbert Sandford | 591 | 9.9% | |
| Green | Nicola Bannon | 109 | 1.8% | |
| Majority | 240 | 4.0% | ||
| Turnout | 5,995 | 64.7% | ||
| Labour gain from Conservative | ||||
Peverell

| Party | Candidate | Votes | % | |
|---|---|---|---|---|
| Conservative | Martin Leaves | 2,871 | 40.0% | |
| Labour | Jon Taylor | 1,782 | 24.8% | |
| Liberal Democrats | Emma Swann | 1,769 | 24.6% | |
| UKIP | Christopher Vitali | 465 | 6.5% | |
| Green | Gavin Fennell | 270 | 3.8% | |
| Vivamus | Bernard Toolan | 23 | 0.3% | |
| Majority | 1,089 | 15.2% | ||
| Turnout | 7,180 | 71.2% | ||
| Labour hold | ||||
Plympton Chaddlewood

| Party | Candidate | Votes | % | |
|---|---|---|---|---|
| Conservative | Glenn Jordan | 1,816 | 45.9% | |
| Liberal Democrats | Michael Symons | 970 | 24.5% | |
| Labour | Val Burns | 781 | 19.7% | |
| UKIP | Jonathan Frost | 393 | 9.9% | |
| Majority | 846 | 21.4% | ||
| Turnout | 3,960 | 64.1% | ||
| Conservative hold | ||||
Plympton St Mary

| Party | Candidate | Votes | % | |
|---|---|---|---|---|
| Conservative | David James | 3,597 | 50.8% | |
| Liberal Democrats | Catherine Symons | 1,427 | 20.1% | |
| Labour | Ross Burns | 1,424 | 20.1% | |
| UKIP | Bill Baser | 639 | 9.0% | |
| Majority | 2,170 | 30.6% | ||
| Turnout | 7,087 | 70.3% | ||
| Conservative hold | ||||
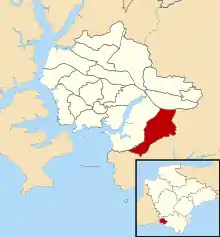
Plymstock Dunstone
| Party | Candidate | Votes | % | |
|---|---|---|---|---|
| Conservative | Vivien Pengelly | 3,363 | 48.5% | |
| Liberal Democrats | Richard Smith | 1,578 | 22.7% | |
| Labour | Roger Williams | 1,235 | 17.8% | |
| UKIP | Alan Skuse | 763 | 11.0% | |
| Majority | 1,785 | 25.7% | ||
| Turnout | 6,939 | 70.6% | ||
| Conservative hold | ||||
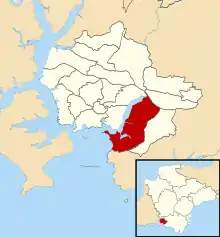
Plymstock Radford
| Party | Candidate | Votes | % | |
|---|---|---|---|---|
| Conservative | Wendy Foster | 2,681 | 40.2% | |
| Liberal Democrats | Ian Veater | 1,463 | 21.9% | |
| Labour | Steven Lemin | 1,092 | 16.4% | |
| Independent | Roger Dodd | 828 | 12.4% | |
| UKIP | Roger Bullock | 613 | 9.2% | |
| Majority | 1,218 | 18.2% | ||
| Turnout | 6,677 | 68.3% | ||
| Conservative hold | ||||
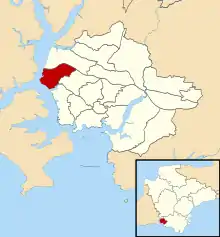
St Budeax
| Party | Candidate | Votes | % | |
|---|---|---|---|---|
| Labour | Sally Bowie | 2,226 | 40.8% | |
| Conservative | Frederick Brimacombe | 1,450 | 26.6% | |
| Liberal Democrats | Bailey Sam | 905 | 16.6% | |
| UKIP | Paul Bedson | 696 | 12.7% | |
| Green | Nick Byrne | 105 | 1.9% | |
| Independent | Paul Colwill | 79 | 1.4% | |
| Majority | 776 | 14.2% | ||
| Turnout | 5,461 | 63.9% | ||
| Labour hold | ||||
St Peter and the Waterfront

| Party | Candidate | Votes | % | |
|---|---|---|---|---|
| Labour | Sue McDonald | 1,689 | 33.8% | |
| Conservative | Carol Ellmers | 1,525 | 30.5% | |
| Liberal Democrats | Hugh Janes | 1,096 | 21.9% | |
| UKIP | Sean O'Kane | 398 | 8.0% | |
| Green | Matt Slaughter | 190 | 3.8% | |
| Independent | Ray Rees | 102 | 2.0% | |
| Majority | 164 | 3.3% | ||
| Turnout | 5,000 | 56.9% | ||
| Labour hold | ||||
Southway

| Party | Candidate | Votes | % | |
|---|---|---|---|---|
| Conservative | Thomas Browne | 2,183 | 36.1% | |
| Labour | David Weekes | 2,160 | 35.7% | |
| Liberal Democrats | Marion Roch | 1,029 | 17.0% | |
| UKIP | Fern Burgess | 678 | 11.2% | |
| Majority | 23 | 0.4% | ||
| Turnout | 6,050 | 52.8% | ||
| Conservative hold | ||||
Stoke

| Party | Candidate | Votes | % | |
|---|---|---|---|---|
| Conservative | Jill Dolan | 2,030 | 33.9% | |
| Labour | Philippa Davey | 1,880 | 31.4% | |
| Liberal Democrats | Paul Brown-Church | 1,335 | 22.3% | |
| UKIP | John Elliott | 542 | 9.0% | |
| Green | Wendy Miller | 209 | 3.5% | |
| Majority | 150 | 2.5% | ||
| Turnout | 5,996 | 64.6% | ||
| Conservative hold | ||||
Sutton and Mount Gould

| Party | Candidate | Votes | % | |
|---|---|---|---|---|
| Labour | Mary Aspinall | 1,911 | 33.5% | |
| Liberal Democrats | Peter York | 1,549 | 27.2% | |
| Conservative | Edmund Shillabeer | 1,493 | 26.2% | |
| UKIP | Jonquil Webber | 468 | 8.2% | |
| Green | Tean Mitchell | 283 | 5.0% | |
| Majority | 362 | 6.3% | ||
| Turnout | 5,704 | 57.6% | ||
| Labour hold | ||||
See also
References
- "Election 2010 - Plymouth Council". BBC News.
- "Local government structure and elections". GOV.UK. Retrieved 27 April 2018.
- "Election Timetable in England" (PDF).
- "Local Elections Archive Project - 2006 - Plymouth". www.andrewteale.me.uk. Retrieved 7 May 2018.
- "Ham by-election". Plymouth City Council. 3 September 2009. Retrieved 8 May 2010.
- "Plymouth City Council election results 2006". Plymouth City Council. 4 May 2006. Retrieved 8 May 2010.
- "Plymouth City Council election results 2010". Plymouth City Council. 6 May 2010. Retrieved 8 May 2010.