2008 City of Lincoln Council election
The 2008 City of Lincoln Council election took place on 1 May 2008 to elect members of City of Lincoln Council in Lincolnshire, England. This was held on the same day as other local elections. One third 33 seats were up for election, with one councillor in each of the 11 wards being elected. As the previous election in 2007 had been an all-out election with new ward boundaries, the seats of the candidates that had finished third in each ward in 2016 were up for election. The Conservative Party retained control of the council.[3][4]
| |||||||||||||||||||||||||||||||||
11 of the 33 seats to City of Lincoln Council 17 seats needed for a majority | |||||||||||||||||||||||||||||||||
|---|---|---|---|---|---|---|---|---|---|---|---|---|---|---|---|---|---|---|---|---|---|---|---|---|---|---|---|---|---|---|---|---|---|
| Turnout | 31.4% | ||||||||||||||||||||||||||||||||
| |||||||||||||||||||||||||||||||||
 Map showing the results the 2008 Lincoln City Council elections by ward. Red shows Labour seats and blue shows the Conservatives. | |||||||||||||||||||||||||||||||||
| |||||||||||||||||||||||||||||||||
Election result
| Party | Seats | Gains | Losses | Net gain/loss | Seats % | Votes % | Votes | +/− | |
|---|---|---|---|---|---|---|---|---|---|
| Conservative | 7 | 1 | 0 | 63.6 | 44.5 | 8,797 | |||
| Labour | 3 | 0 | 1 | 27.3 | 32.6 | 6,454 | |||
| Liberal Democrats | 1 | 0 | 0 | 9.1 | 14.8 | 2,924 | |||
| BNP | 0 | 0 | 0 | 0.0 | 5.6 | 1,106 | |||
| Independent | 0 | 0 | 0 | 0.0 | 1.0 | 188 | |||
| UKIP | 0 | 0 | 0 | 0.0 | 0.9 | 187 | |||
| Socialist Alternative | 0 | 0 | 0 | 0.0 | 0.6 | 127 | |||
| Total | 11 | 19,783 | |||||||
Ward results
Abbey

Location of Abbey ward
| Party | Candidate | Votes | % | |
|---|---|---|---|---|
| Labour | Kath Brothwell | 657 | 40.0% | |
| Conservative | Cordelia McCartney | 625 | 38.1% | |
| Liberal Democrats | Heather Cullen | 259 | 15.8% | |
| UKIP | Carol Pearson | 101 | 6.2% | |
| Majority | 32 | 1.9% | ||
| Turnout | 1,642 | 25.2% | ||
| Labour hold | ||||
Birchwood

Location of Birchwood ward
| Party | Candidate | Votes | % | |
|---|---|---|---|---|
| Conservative | John Metcalfe | 740 | 43.5% | |
| Labour | Stephen Allnutt | 464 | 27.2% | |
| Independent | Jack Humphries | 188 | 11.0% | |
| BNP | Philip Marshall | 183 | 10.7% | |
| Liberal Democrats | George Richardson | 128 | 7.5% | |
| Majority | 276 | 16.2% | ||
| Turnout | 1,703 | 30.0% | ||
| Conservative hold | ||||
Boultham
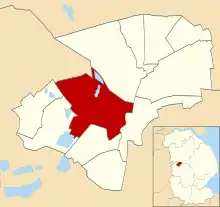
Location of Boultham ward
| Party | Candidate | Votes | % | |
|---|---|---|---|---|
| Labour | Richard Coupland | 667 | 35.4% | |
| Conservative | Andrew Bradley | 655 | 34.8% | |
| BNP | Colin Westcott | 342 | 18.2% | |
| Liberal Democrats | Ross Pepper | 218 | 11.6% | |
| Majority | 12 | 0.6% | ||
| Turnout | 1,882 | 33.5% | ||
| Labour hold | ||||
Bracebridge
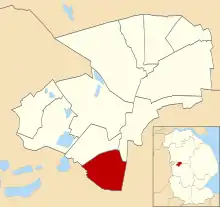
Location of Bracebridge ward
| Party | Candidate | Votes | % | |
|---|---|---|---|---|
| Conservative | Marc Jones | 1,126 | 60.1% | |
| Labour | David Rimmington | 517 | 27.6% | |
| BNP | Dean Lowther | 230 | 12.3% | |
| Majority | 609 | 32.5% | ||
| Turnout | 1,873 | 32.6% | ||
| Conservative hold | ||||
Carholme

Location of Carholme ward
| Party | Candidate | Votes | % | |
|---|---|---|---|---|
| Liberal Democrats | Helen Heath | 852 | 41.9% | |
| Labour | Malcolm Withers | 547 | 26.9% | |
| Conservative | Daniel Hutchinson | 509 | 25.0% | |
| Socialist Alternative | Nick Parker | 127 | 6.2% | |
| Majority | 305 | 15.0% | ||
| Turnout | 2,035 | 30.6% | ||
| Liberal Democrats hold | ||||
Castle
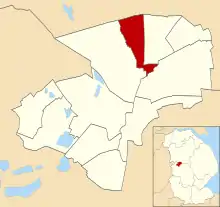
Location of Castle ward
| Party | Candidate | Votes | % | |
|---|---|---|---|---|
| Conservative | Alister Williams | 783 | 43.3% | |
| Labour | Rachel Taylor | 699 | 38.6% | |
| Liberal Democrats | Charles Shaw | 327 | 18.1% | |
| Majority | 84 | 4.6% | ||
| Turnout | 1,809 | 32.3% | ||
| Conservative gain from Labour | ||||
Glebe
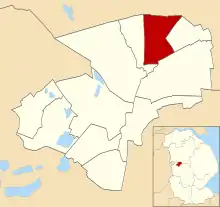
Location of Glebe ward
| Party | Candidate | Votes | % | |
|---|---|---|---|---|
| Conservative | David Denman | 832 | 49.1% | |
| Labour | Larry Wells | 524 | 30.9% | |
| BNP | Alan Kirk | 174 | 10.3% | |
| Liberal Democrats | Stephen Morgan | 166 | 9.8% | |
| Majority | 308 | 18.2% | ||
| Turnout | 1,696 | 31.2% | ||
| Conservative hold | ||||
Hartsholme
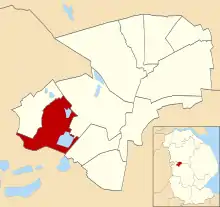
Location of Hartsholme ward
| Party | Candidate | Votes | % | |
|---|---|---|---|---|
| Conservative | Andrew Kerry | 1,212 | 65.5% | |
| Labour | Tony Duncan | 347 | 18.8% | |
| Liberal Democrats | Lynn Pepper | 291 | 15.7% | |
| Majority | 865 | 46.8% | ||
| Turnout | 1,850 | 34.5% | ||
| Conservative hold | ||||
Minster

Location of Minster ward
| Party | Candidate | Votes | % | |
|---|---|---|---|---|
| Conservative | Sandra Gratrick | 1,093 | 52.0% | |
| Labour | Judy Renshaw | 769 | 36.6% | |
| Liberal Democrats | Daphne Shaw | 238 | 11.3% | |
| Majority | 324 | 15.4% | ||
| Turnout | 2,100 | 37.2% | ||
| Conservative hold | ||||
Moorland

Location of Moorland ward
| Party | Candidate | Votes | % | |
|---|---|---|---|---|
| Conservative | Paul Grice | 859 | 46.5% | |
| Labour | Bob Bushell | 646 | 34.9% | |
| BNP | Olivia Wolverson | 177 | 9.6% | |
| Liberal Democrats | Jenny Shaw | 167 | 9.0% | |
| Majority | 213 | 11.5% | ||
| Turnout | 1,849 | 32.5% | ||
| Conservative hold | ||||
Park

Location of Park ward
| Party | Candidate | Votes | % | |
|---|---|---|---|---|
| Labour | Brent Charlesworth | 617 | 45.9% | |
| Conservative | Sally Grice | 363 | 27.0% | |
| Liberal Democrats | Ryan Cullen | 278 | 20.7% | |
| UKIP | Steve Pearson | 86 | 6.4% | |
| Majority | 254 | 18.9% | ||
| Turnout | 1,344 | 25.2% | ||
| Labour hold | ||||
References
- Andrew Teale. "Local Election Results 2008". Local Elections Archive Project.
- Rallings, Colin; Thrasher, Michael (2008). Local Elections Handbook 2008 (PDF). University of Plymouth, Plymouth, UK: Local Government Chronicle Elections Centre. p. 11.
- "Elections 2008". BBC News.
- "Local elections 2008" (PDF). House of Commons Library. 12 June 2008. p. 17.
- "City of Lincoln Council Election Results 1973-2012". Elections Centre. Retrieved 29 October 2019.
This article is issued from Wikipedia. The text is licensed under Creative Commons - Attribution - Sharealike. Additional terms may apply for the media files.