2000 United States gubernatorial elections
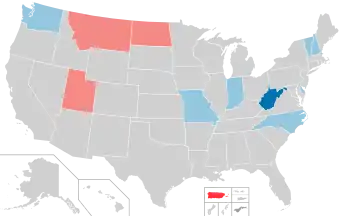
The 2000 United States gubernatorial elections were held on November 7, 2000 in 11 states and two territories. The elections coincided with the presidential election.
| |||||||||||||||||||||||||
13 governorships 11 states; 2 territories | |||||||||||||||||||||||||
|---|---|---|---|---|---|---|---|---|---|---|---|---|---|---|---|---|---|---|---|---|---|---|---|---|---|
| |||||||||||||||||||||||||
 Map of the Results Democratic hold Republican hold Democratic gain Popular Democratic gain Nonpartisan No election | |||||||||||||||||||||||||
Election results
Only the governorship of West Virginia changed party hands in 2000, when Democrat Bob Wise defeated Republican incumbent Cecil Underwood.
| State | Incumbent | Party | Status | Opposing candidates |
|---|---|---|---|---|
| Delaware | Tom Carper | Democratic | Term-limited, Democratic victory | Ruth Ann Minner (Democratic) 59.2% John Burris (Republican) 39.7% Floyd McDowell (Ind. Delaware) 1.1% |
| Indiana | Frank O'Bannon | Democratic | Re-elected, 56.6% | David McIntosh (Republican) 41.7% Andrew Horning (Libertarian) 1.8% |
| Missouri | Roger Wilson | Democratic | Retired, Democratic victory | Bob Holden (Democratic) 49.1% Jim Talent (Republican) 48.2% Larry Rice (Independent) 1.5% John Swenson (Libertarian) 0.5% Lavoy Reed (Green) 0.4% Richard Kline (Reform) 0.2% Richard Smith (Constitution) 0.1% |
| Montana | Marc Racicot | Republican | Term-limited, Republican victory | Judy Martz (Republican) 51% Mark O'Keefe (Democratic) 47.1% Stan Jones (Libertarian) 1.9% |
| New Hampshire | Jeanne Shaheen | Democratic | Re-elected, 48.7% | Gordon Humphrey (Republican) 43.8% Mary Brown (Independent) 6.4% John Babiarz (Libertarian) 1.1% |
| North Carolina | Jim Hunt | Democratic | Term-limited, Democratic victory | Mike Easley (Democratic) 52% Richard Vinroot (Republican) 46.3% Barbara Howe (Libertarian) 1.5% Douglas Schell (Reform) 0.3% |
| North Dakota | Ed Schafer | Republican | Retired, Republican victory | John Hoeven (Republican) 55% Heidi Heitkamp (Democratic) 45% |
| Utah | Mike Leavitt | Republican | Re-elected, 55.8% | Bill Orton (Democratic) 42.7% Jeremy Friedbaum (Independent American) 2% |
| Vermont | Howard Dean | Democratic | Re-elected, 50.4% | Ruth Dwyer (Republican) 37.9% Anthony Pollina (Progressive) 9.5% Phil Stannard (Independent) 0.7% Joel Williams (Vermont Grassroots) 0.5% Hardy Macia (Libertarian) 0.3% Richard Gottlieb (Liberty Union) 0.1% |
| Washington | Gary Locke | Democratic | Re-elected, 58.4 | John Carlson (Republican) 39.7% Steve LePage (Libertarian) 1.9% |
| West Virginia | Cecil Underwood | Republican | Defeated, 47.2% | Bob Wise (Democratic) 50.1% Denise Giardina (Mountain) 1.6% Bob Myers (Libertarian) 0.9% Randall Ashelman (Natural Law) 0.2% |
| Territory | Incumbent | Party | Status | Competing candidates |
|---|---|---|---|---|
| American Samoa[1] | Tauese Sunia | Democratic | Re-elected, 51.44% | Lealaifuaneva Peter Reid (Independent) 48.57% |
| Puerto Rico | Pedro Rosselló | PNP/Democratic | Retired, PPD/Democratic victory | Sila Calderón (PPD/Democratic) 48.6 Carlos Pesquera (PNP/Democratic) 45.7% Rubén Berríos (Puerto Rican Independence Party) 5.2% |
See also
This article is issued from Wikipedia. The text is licensed under Creative Commons - Attribution - Sharealike. Additional terms may apply for the media files.

.jpg.webp)