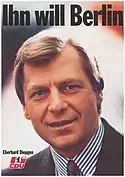
1990 Berlin state election
The 1990 Berlin state election was held on 2 December 1990 to elect the members of the 12th Abgeordnetenhaus of Berlin. This was the first election held in Berlin after the reunification of Germany and Berlin, and was held on the same day as the 1990 federal election.
| |||||||||||||||||||||||||||||||||||||||||||||||||
All 241 seats of the Abgeordnetenhaus of Berlin 121 seats needed for a majority | |||||||||||||||||||||||||||||||||||||||||||||||||
|---|---|---|---|---|---|---|---|---|---|---|---|---|---|---|---|---|---|---|---|---|---|---|---|---|---|---|---|---|---|---|---|---|---|---|---|---|---|---|---|---|---|---|---|---|---|---|---|---|---|
| Turnout | 2,019,198 (80.8%) | ||||||||||||||||||||||||||||||||||||||||||||||||
| |||||||||||||||||||||||||||||||||||||||||||||||||
| |||||||||||||||||||||||||||||||||||||||||||||||||
The Christian Democratic Union (CDU) emerged as the largest party with 40.4%, with the Social Democratic Party (SPD) second on 30.4%. The Party of Democratic Socialism (PDS) won 9.2%, while the Free Democratic Party (FDP) won 7.1%. Two green parties, the Alternative List from the West and the Alliance 90 from the East, entered the Abgeordnetenhaus with 5.0% and 4.4% respectively. The 5% electoral threshold for entry was applied separately in the old West and East of the city, allowing both parties to enter despite both falling short of 5% statewide. They subsequently formed a joint parliamentary group, and later merged to become the Berlin branch of Alliance 90/The Greens.
A potential CDU–FDP government came up two seats short of a majority, and no left-of-centre arrangement was possible due to the presence of PDS. Thus, the CDU and SPD entered into a grand coalition, and CDU leader and former Mayor Eberhard Diepgen was elected as the first Mayor of reunified Berlin.[1]
Parties
The table below lists the parties and groupings competing in the election which were represented in the 11th Abgeordnetenhaus of West Berlin (elected in 1989) and the last city council of East Berlin (elected in May 1990). Parties are listed in order of the number of seats they held in both city legislatures.
| Name | Ideology | Leader(s) | 1989 result (West) | 1990 result (East) | ||||
|---|---|---|---|---|---|---|---|---|
| Votes (%) | Seats | Votes (%) | Seats | |||||
| SPD | Social Democratic Party of Germany Sozialdemokratische Partei Deutschlands |
Social democracy | Walter Momper | 37.3% | 55 / 138 |
34.1%[lower-alpha 1] | 47 / 138 | |
| CDU | Christian Democratic Union of Germany Christlich Demokratische Union Deutschlands |
Christian democracy | Eberhard Diepgen | 37.7% | 55 / 138 |
18.4%[lower-alpha 2] | 25 / 138 | |
| PDS | Party of Democratic Socialism Partei des Demokratischen Sozialismus |
Democratic socialism | N/A | 30.1% | 42 / 138 | |||
| Bü90/Grüne/UFV | Alliance 90/Green/UFV Bündnis 90/Grüne/UFV |
Green politics | N/A | 12.6%[lower-alpha 3] | 18 / 138 | |||
| Grüne/AL | Green/Alternative List Grüne/Alternativen Liste |
Green politics | 11.8% | 17 / 138 |
N/A | |||
| REP | The Republicans Die Republikaner |
National conservatism | 7.5% | 11 / 138 |
N/A | |||
| FDP | Free Democratic Party Freie Demokratische Partei |
Classical liberalism | 3.9% | 0 / 138 |
2.3%[lower-alpha 4] | 3 / 138 | ||
| DSU | German Social Union Deutsche Soziale Union |
National conservatism | N/A | 1.0% | 2 / 138 | |||
Election result
Summary of the 2 December 1990 election results for the Abgeordnetenhaus of Berlin
| Party | Votes | % | Seats | Seats % | |||
|---|---|---|---|---|---|---|---|
| Christian Democratic Union (CDU) | 815,382 | 40.4 | 101 | 41.9 | |||
| Social Democratic Party (SPD) | 614,075 | 30.4 | 76 | 31.5 | |||
| Party of Democratic Socialism (PDS) | 184,820 | 9.2 | 23 | 9.5 | |||
| Free Democratic Party (FDP) | 143,080 | 7.1 | 18 | 7.5 | |||
| Green/Alternative List (Grüne/AL) | 100,839 | 5.0 | 12 | 5.0 | |||
| Alliance 90/Green/VFU (Bü90/Grüne/UFV) | 87,891 | 4.4 | 11 | 4.6 | |||
| The Republicans (REP) | 62,041 | 3.1 | 0 | 0 | |||
| Ecological Democratic Party (ÖDP) | 5,160 | 0.3 | 0 | 0 | |||
| German Social Union (DSU) | 4,539 | 0.2 | 0 | 0 | |||
| League of German Democrats (DDD) | 1,371 | 0.1 | 0 | 0 | |||
| Total | 2,019,198 | 100.0 | 241 | ||||
| Voter turnout | 80.8 | ||||||
Notes
- Results for the Social Democratic Party in the GDR, which merged with the Western SPD in 1990.
- Results for the CDU (17.7%, 24 seats) and DA (0.6%, 1 seat). The two parties merged with the Western CDU in 1990.
- Results for Alliance 90 (9.9%, 14 seats) and the Green Party (2.7%, 4 seats).
- Results for the Association of Free Democrats (1.2%, 2 seats) and FDP (1.0%, 1 seat). The two parties merged with the Western FDP in 1990.
References
- "Die Landeswahlleiterin für Berlin - Historie - Vergangene Wahlen". www.wahlen-berlin.de.

