1985 Monaghan County Council election
An election to Monaghan County Council took place on 20 June 1985 as part of that year's Irish local elections. 20 councillors were elected from four electoral divisions by PR-STV voting for a five-year term of office.
| |||||||||||||||||||||||||||||||||
All 20 seats to Monaghan County Council | |||||||||||||||||||||||||||||||||
|---|---|---|---|---|---|---|---|---|---|---|---|---|---|---|---|---|---|---|---|---|---|---|---|---|---|---|---|---|---|---|---|---|---|
| |||||||||||||||||||||||||||||||||
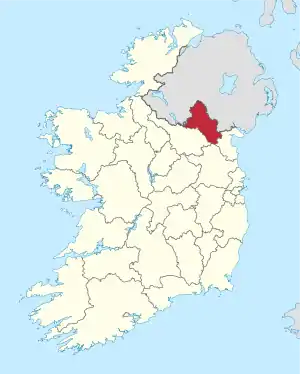
 Map showing the area of Monaghan County Council | |||||||||||||||||||||||||||||||||
| |||||||||||||||||||||||||||||||||
Results by party
| Party | Seats | ± | First Pref. votes | FPv% | ±% | |
|---|---|---|---|---|---|---|
| Fianna Fáil | 10 | +1 | 11,607 | 44.24% | ||
| Fine Gael | 7 | -1 | 8,791 | 33.51% | ||
| Sinn Féin | 2 | +2 | 3,168 | 12.07% | ||
| Independent | 1 | -2 | 2,455 | 9.36% | ||
| Totals | 20 | - | 26,237 | 100% | — | |
Results by Electoral Area
Carrickmacross
| Carrickmacross - 5 seats | |||||||||||||
|---|---|---|---|---|---|---|---|---|---|---|---|---|---|
| Party | Candidate | FPv% | Count 1 | Count 2 | Count 3 | Count 4 | Count 5 | Count 6 | Count 7 | Count 8 | Count 9 | ||
| Fianna Fáil | Dr Rory O'HanlonTD* | 1,565 | |||||||||||
| Fine Gael | Bill Cotter | 944 | 968 | 1,013 | 1,024 | 1,040 | 1,112 | 1,322 | |||||
| Fine Gael | Patrick Jones* | 828 | 843 | 857 | 863 | 936 | 1,050 | 1,383 | |||||
| Fine Gael | Patrick Ruxton | 634 | 654 | 657 | 662 | 672 | 734 | ||||||
| Fianna Fáil | Pádraig McNally* | 629 | 738 | 760 | 835 | 992 | 1,040 | 1,103 | 1,171 | ||||
| Sinn Féin | Rose McMahon | 562 | 573 | 617 | 649 | 691 | 817 | 852 | 888 | 912 | |||
| Independent | Peter Murphy | 558 | 575 | 587 | 650 | 663 | |||||||
| Fianna Fáil | Rosaleen O'Hanlon | 398 | 532 | 567 | 625 | 768 | 894 | 952 | 985 | 1,025 | |||
| Fianna Fáil | Tom Freeman | 388 | 431 | 436 | 470 | ||||||||
| Fianna Fáil | Patrick McKenna | 274 | 293 | 297 | |||||||||
| Workers' Party | Francis O'Donoghue | 193 | 203 | ||||||||||
| Electorate: 9,068 Valid: 6,973 (77.69%) Spoilt: 72 Quota: 1,163 Turnout: 7,045 | |||||||||||||
Castleblayney
| Castleblayney- 5 seats | |||||||||
|---|---|---|---|---|---|---|---|---|---|
| Party | Candidate | FPv% | Count 1 | Count 2 | Count 3 | Count 4 | Count 5 | ||
| Fianna Fáil | Francis O'Brien* | 1,397 | |||||||
| Fine Gael | Arthur Carville* | 1,200 | |||||||
| Fine Gael | John F. ConlanTD* | 1,049 | 1,128 | ||||||
| Fianna Fáil | Macartan McCormack* | 947 | 1,101 | ||||||
| Fianna Fáil | Brendan Hughes* | 811 | 895 | 942 | 998 | 1,017 | |||
| Fine Gael | Adam Armstrong | 782 | 792 | 891 | 912 | 929 | |||
| Independent | Edmund O'Donnell | 99 | 117 | 120 | |||||
| Green Alliance | Eugene Meegan | 14 | 16 | 17 | |||||
| Electorate: 8,696 Valid: 6,299 (73.2%) Spoilt: 66 Quota: 1,050 Turnout: 6,365 | |||||||||
Clones
| Clones - 4 seats | ||||||||
|---|---|---|---|---|---|---|---|---|
| Party | Candidate | FPv% | Count 1 | Count 2 | Count 3 | Count 4 | ||
| Fianna Fáil | Jimmy LeonardTD* | 1,771 | ||||||
| Sinn Féin | Pat Treanor | 906 | 979 | 1,029 | 1,071 | |||
| Fine Gael | Hugh McElvaney* | 868 | 934 | 1,290 | ||||
| Independent | William Doogan* | 754 | 772 | 825 | 918 | |||
| Fine Gael | Peter Toal | 470 | 520 | |||||
| Fianna Fáil | Patrick McKenna* | 359 | 871 | 951 | 1,013 | |||
| Independent | Joseph Duffy | 59 | 61 | |||||
| Electorate: 7,465 Valid: 5,197 (71.01%) Spoilt: 104 Quota: 1,040 Turnout: 5,301 | ||||||||
Monaghan
| Monaghan - 6 seats | ||||||||||
|---|---|---|---|---|---|---|---|---|---|---|
| Party | Candidate | FPv% | Count 1 | Count 2 | Count 3 | Count 4 | Count 5 | Count 6 | ||
| Sinn Féin | Caoimhghin O Caolain | 1,700 | ||||||||
| Fianna Fáil | Patsy Treanor* | 1,363 | ||||||||
| Fianna Fáil | Willie McKenna* | 1,191 | ||||||||
| Independent | James Wright* | 985 | 1,033 | 1,051 | 1,067 | 1,078 | 1,084 | |||
| Fine Gael | Thomas Reilly* | 886 | 981 | 1,163 | ||||||
| Fine Gael | Stephen McAree* | 786 | 887 | 989 | 1,034 | 1,050 | 1,095 | |||
| Fianna Fáil | Matt Caulfield | 514 | 807 | 824 | 1,016 | 1,070 | 1,072 | |||
| Fine Gael | Patrick Macklin | 344 | 397 | |||||||
| Electorate: 11,124 Valid: 7,768 (70.95%) Spoilt: 125 Quota: 1,110 Turnout: 7,893 | ||||||||||
External links
- Official website
- Irishelectionliterature
- Department of the Environment, Ireland (28 January 2010). "Local elections, 1985 : election results and transfer of votes in respect of each county, and county borough council : and election statistics relating to all local authorities" (PDF). Department of the Environment. Retrieved 28 October 2019.
| Preceded by 1979 Monaghan County Council election |
Monaghan County Council elections | Succeeded by 1991 Monaghan County Council election |
This article is issued from Wikipedia. The text is licensed under Creative Commons - Attribution - Sharealike. Additional terms may apply for the media files.