MIPI Debug Architecture
MIPI Alliance Debug Architecture provides a standardized infrastructure for debugging deeply embedded systems in the mobile and mobile-influenced space. The MIPI Alliance MIPI Debug Working Group has released a portfolio of specifications; their objective is to provide standard debug protocols and standard interfaces from a system on a chip (SoC) to the debug tool. The whitepaper Architecture Overview for Debug summarizes all the efforts. In recent years, the group focused on specifying protocols that improve the visibility of the internal operations of deeply embedded systems, standardizing debug solutions via the functional interfaces of form factor devices, and specifying the use of I3C as debugging bus.[1][2]
The term "debug"
The term "debug" encompasses the various methods used to detect, triage, trace, and potentially eliminate mistakes, or bugs, in hardware and software. Debug includes control/configure methods, stop/step mode debugging, and various forms of tracing.
Control/configure methods
Debug can be used to control and configure components, including embedded systems, of a given target system. Standard functions include setting up hardware breakpoints, preparing and configuring the trace system, and examining system states.
Stop/step mode debugging
In stop/step mode debugging, the core/microcontroller is stopped through the use of breakpoints and then "single-stepped" through the code by executing instructions one at a time. If the other cores/microcontrollers of the SoC have finished synchronously, the overall state of the system can be examined. Stop/step mode debugging includes control/configure techniques, run control of a core/microcontroller, start/stop synchronization with other cores, memory and register access, and additional debug features such as performance counter and run-time memory access.
Tracing
Traces allow an in-depth analysis of the behavior and the timing characteristics of an embedded system. The following traces are typical:
- A "core trace" provides full visibility of program execution on an embedded core. Trace data are created for the instruction execution sequence (sometimes referred to as an instruction trace) and data transfers (sometimes referred to as a data trace). An SoC may generate several core traces.
- A "bus trace" provides complete visibility of the data transfers across a specific bus.
- A "system trace" provides visibility of various events/states inside the embedded system. Trace data can be generated by instrument application code and by hardware modules within the SoC. An SoC may generate several system traces.
Visibility of SoC-internal operations

Tracing is the tool of choice to monitor and analyze what is going on in a complex SoC. There are several well established non-MIPI core-trace and bus-trace standards for the embedded market. Thus, there was no need for the MIPI Debug Working Group to specify new ones. But no standard existed for a "system trace" when the Debug Working Group published its first version of the MIPI System Trace Protocol (MIPI STP) in 2006.
MIPI System Software Trace (MIPI SyS-T)
The generation of system trace data from the software is typically done by inserting additional function calls, which produce diagnostic information valuable for the debug process. This debug technique is called instrumentation. Examples are: printf-style string generating functions, value information, assertions, etc. The purpose of MIPI System Software Trace (MIPI SyS-T) is to define a reusable, general-purpose data protocol and instrumentation API for debugging. The specification defines message formats that allow a trace-analysis tool to decode the debug messages, either into human-readable text or to signals optimized for automated analysis.
Since verbose textual messages stress bandwidth limits for debugging, so-called "catalog messages" are provided. Catalog messages are compact binary messages that replace strings with numeric values. The translation from the numeric value to a message string is done by the trace analysis tool, with the help of collateral XML information. This information is provided during the software-build process using an XML schema that is part of the specification as well.
The SyS-T data protocol is designed to work efficiently on top of lower-level transport links such as those defined by the MIPI System Trace Protocol. SyS-T protocol features such as timestamping or data-integrity checksums can be disabled if the transport link already provides such capabilities. The use of other transport links—such as UART, USB, or TCP/IP—is also possible.
The MIPI Debug Working Group will provide an open-source reference implementation for the SyS-T instrumentation API, a SyS-T message pretty printer, and a tool to generate the XML collateral data as soon as the Specification for System Software Trace (SyS-T) is approved.[3]
MIPI System Trace Protocol (MIPI STP)

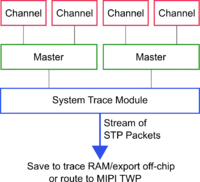
The MIPI System Trace Protocol (MIPI STP) specifies a generic protocol that allows the merging of trace streams originated from anywhere in the SoC to a trace stream of 4-bit frames. It was intentionally designed to merge system trace information. The MIPI System Trace Protocol uses a channel/master topology that allows the trace receiving analysis tool to collate the individual trace streams for analysis and display. The protocol additionally provides the following features: stream synchronization and alignment, trigger markers, global timestamping, and multiple stream time synchronization.
The stream of STP packets produced by the System Trace Module can be directly saved to trace RAM, directly exported off-chip, or can be routed to a "trace wrapper protocol" (TWP) module to merge with further trace streams. ARM's CoreSight System Trace Macrocell,[4] which is compliant with MIPI STP, is today an integral part of most multi-core chips used in the mobile space.
The last MIPI board-adopted version of Specification for System Trace Protocol (STPSM) is version 2.2 (February 2016).[5]
MIPI Trace Wrapper Protocol (MIPI TWP)
The MIPI Trace Wrapper Protocol enables multiple trace streams to be merged into a single trace stream (byte streams). A unique ID is assigned to each trace stream by a wrapping protocol. The detection of byte/word boundaries is possible even if the data is transmitted as a stream of bits. Inert packets are used if a continuous export of trace data is required. MIPI Trace Wrapper Protocol is based on ARM's Trace Formatter Protocol specified for ARM CoreSight.
The last MIPI board-adopted version of Specification for Trace Wrapper Protocol (TWPSM) is version 1.1 (December 2014).[6]
From dedicated to functional interfaces

Dedicated debug interfaces

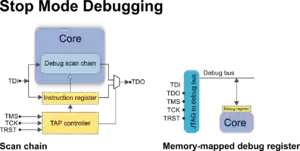
In the early stages of product development, it is common to use development boards with dedicated and readily accessible debug interfaces for connecting the debug tools. SoCs employed in the mobile market rely on two debug technologies: stop-mode debugging via a scan chain and stop-mode debugging via memory-mapped debug registers.
The following non-MIPI debug standards are well established in the embedded market: IEEE 1149.1 (5-pin) and ARM Serial Wire Debug (2-pin), both using single-ended pins. Thus, there was no need for the MIPI Debug Working Group to specify a stop-mode debug protocol or to specify a debug interface.
Trace data generated and merged to a trace stream within the SoC can be streamed, via a dedicated unidirectional trace interface, off-chip to a trace analysis tool. The MIPI Debug Architecture provides specifications for both parallel and serial trace ports.
The MIPI Parallel Trace Interface (MIPI PTI) specifies how to pass the trace data to multiple data pins and a clock pin (single-ended). The specification includes signal names and functions, timing, and electrical constraints. The last MIPI board-adopted version of Specification for Parallel Trace Interface is version 2.0 (October 2011).[7]
The MIPI High-Speed Trace Interface (MIPI HTI) specifies how to stream trace data over the physical layer of standard interfaces, such as PCI Express, DisplayPort, HDMI, or USB. The current version of the specification allows for one to six lanes. The specification includes:
- The PHY layer, which represents the electrical and clocking characteristics of the serial lanes.
- The LINK layer, which defines how the trace is packaged into the Aurora 8B/10B protocol.
- A programmer's model for controlling the HTI and providing status information.

The HTI is a subset of the High Speed Serial Trace Port (HSSTP) specification defined by ARM.[8] The last MIPI board-adopted version of Specification for High-speed Trace Interface is version 1.0 (July 2016).[9]
Board developers and debug tool vendors benefit from standard debug connectors and standard pin mappings. The MIPI Recommendation for Debug and Trace Connectors recommends 10-/20-/34-pin board-level 1.27-millimetre (0.050 in) connectors (MIPI10/20/34). Seven different pin mappings that address a wide variety of debug scenarios have been specified. They include standard JTAG (IEEE 1149.1), cJTAG (IEEE 1149.7) and 4-bit parallel trace interfaces (mainly used for system traces), supplemented by the ARM-specific Serial Wire Debug (SWD) standard.[10] MIPI10/20/34 debug connectors became the standard for ARM-based embedded designs.
Many embedded designs in the mobile space use high-speed parallel trace ports (up to 600 megabits per second per pin). MIPI recommends a 60-pin Samtec QSH/QTH connector named MIPI60, which allows JTAG/cJTAG for run control, up to 40 trace data signals, and up to 4 trace clocks. To minimize complexity, the recommendation defines four standard configurations with one, two, three, or four trace channels of varying width.
The last MIPI board-adopted version of MIPI Alliance Recommendation for Debug and Trace Connectors is version 1.1 (March 2011).[11]
PHY and pin overlaid interfaces


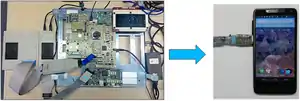
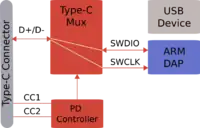
Readily-accessible debug interfaces are not available in the product's final form factor. This hampers the identification of bugs and performance optimization in the end product. Since the debug logic is still present in the end product, an alternative access path is needed. An effective way is to equip a mobile terminal's standard interface with a multiplexer that allows for accessing the debug logic. The switching between the interface's essential function and the debug function can be initiated by the connected debug tool or by the mobile terminal's software. Standard debug tools can be used under the following conditions:
- A switching protocol is implemented on the debug tool and in the mobile terminal.
- A debug adapter exists that connects the debug tool to the standard interface. The debug adapter has to assist the switching protocol if required.
- A mapping from the standard interface pins to the debug pins is specified.
The MIPI Narrow Interface for Debug and Test (MIPI NIDnT) covers debugging via the following standard interfaces: microSD, USB 2.0 Micro-B/-AB receptacle, USB Type-C receptacle, and DisplayPort. The last MIPI board-adopted version of Specification for Narrow Interface for Debug and Test (NIDnTSM) is version 1.2 (December 2017).[12]
Network interfaces

Instead of re-using the pins, debugging can also be done via the protocol stack of a standard interface or network. Here debug traffic co-exists with the traffic of other applications using the same communication link. The MIPI Debug Working Group named this approach GigaBit Debug. Since no debug protocol existed for this approach, the MIPI Debug Working Group specified its SneakPeak debug protocol.
MIPI SneakPeek Protocol (MIPI SPP) moved from a dedicated interface for basic debugging towards a protocol-driven interface:
- It translates incoming command packets into read/write accesses to memory, memory-mapped debug registers, and other memory-mapped system resources.
- It translates command results (status information and read data coming from memory, memory-mapped debug registers, and other memory-mapped system resources) to outgoing response packets.
- Since SneakPeek accepts packets coming through an input buffer and delivers packets through an output buffer, it can be easily connected to any standard I/O or network.
The MIPI Alliance Specification for SneakPeek Protocol describes the basic concepts, the required infrastructure, the packets, and the data flow. The last MIPI board-adopted version of Specification for SneakPeek Protocol (SPPSM) is version 1.0 (August 2015).[13]
The MIPI Gigabit Debug Specification Family is providing details for mapping debug and trace protocols to standard I/Os or networks available in mobile terminals. These details include: endpoint addressing, link initialization and management, data packaging, data-flow management, and error detection and recovery. The last MIPI board-adopted version of Specification for Gigabit Debug for USB (MIPI GbD USB) is version 1.1 (March 2018).[14] The last MIPI board-adopted version of Specification for Gigabit Debug for Internet Protocol Sockets (MIPI GbD IPS) is version 1.0 (July 2016).[15]
I3C as debug bus
Current debug solutions, such as JTAG and ARM CoreSight, are statically structured, which makes for limited scalability regarding the accessibility of debug components/devices. MIPI Debug for I3C specifies a scalable, 2-pin, single-ended debug solution, which has the advantage of being available for the entire product lifetime. The I3C bus can be used as a debug bus only, or the bus can be shared between debug and its essential function as data acquisition bus for sensors. Debugging via I3C works in principle as follows:
- The I3C bus is used for the physical transport, and the native I3C functionality is used to configure the bus and to hot-join new components.
- The debug protocol is wrapped into dedicated I3C commands. Supported debug protocols are JTAG, ARM CoreSight, and MIPI SneakPeek Protocol.[13]
References
- "Debug Working Group". MIPI Alliance. 2019. Retrieved 7 June 2019.
- "Architecture Overview for Debug" (PDF). MIPI Alliance. Version 1.2. 13 July 2018. Retrieved 7 June 2019.
- "MIPI System Software – Trace (MIPI SyS-T)". MIPI Alliance. Version 1.0. April 2018. Retrieved 7 June 2019.
- "System Trace Macrocell". ARM Developer. 2019. Retrieved 7 June 2019.
- "MIPI System Trace Protocol (MIPI STP)". MIPI Alliance. Version 2.2. February 2016. Retrieved 7 June 2019.
- "MIPI Trace Wrapper Protocol (MIPI TWP)". MIPI Alliance. Version 1.1. December 2014. Retrieved 7 June 2019.
- "MIPI Parallel Trace Interface (MIPI PTI)". MIPI Alliance. Version 2.0. October 2011. Retrieved 8 June 2019.
- "CoreSight Architecture Overview: High Speed Serial Trace Port (HSSPT)". ARM Developer. 2019. Retrieved 8 June 2019.
- "MIPI High-Speed Trace Interface (MIPI HTI)". MIPI Alliance. Version 1.0. July 2016. Retrieved 8 June 2019.
- "Serial Wire Debug". ARM Developer. 2019. Retrieved 8 June 2019.
- "MIPI Alliance Recommendation for Debug and Trace Connectors". MIPI Alliance.
- "MIPI Narrow Interface for Debug and Test (MIPI NIDnT)". MIPI Alliance. Version 1.2. December 2017. Retrieved 9 June 2019.
- "MIPI SneakPeek Protocol (MIPI SPP)". MIPI Alliance. Version 1.0. August 2015. Retrieved 9 June 2019.
- "MIPI Gigabit Debug for USB (MIPI GbD USB)". MIPI Alliance. Version 1.1. March 2018. Retrieved 9 June 2019.
- "MIPI Gigabit Debug for IP Sockets (MIPI GbD IPS)". MIPI Alliance. Version 1.0. July 2016. Retrieved 9 June 2019.
External links
- Schulz, Norbert (Intel Corporation) (26 September 2016). How MIPI Debug Specifications Help Me to Develop System SW. MIPI DevCon 2016. Retrieved 9 June 2019.