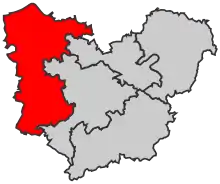
Eure's 3rd constituency
The 3rd constituency of Eure is a French legislative constituency in the Eure département. It contains the cantons of Bernay, Beuzeville, Bourg-Achard and Pont-Audemer.
constituency | |||
 | |||
 Constituency in department | |||
| Deputy |
| ||
|---|---|---|---|
| Department | Eure | ||
Deputies
| Election | Member | Party | |
|---|---|---|---|
| 2002 | Hervé Morin | UDF | |
| 2007 | NC | ||
| 2012 | |||
| 2017 | Marie Tamarelle-Verhaeghe | MoDem | |
Election Results
2017
| Candidate | Label | First round | Second round | |||
|---|---|---|---|---|---|---|
| Votes | % | Votes | % | |||
| Marie Tamarelle-Verhaeghe | MoDem | 12,867 | 30.26 | 20,788 | 59.29 | |
| Timothée Houssin | FN | 9,131 | 21.47 | 14,275 | 40.71 | |
| Pierre Bibet | UDI | 6,879 | 16.18 | |||
| Gwenhaël Lavergne | FI | 5,173 | 12.16 | |||
| Isabelle Duong | DVD | 3,616 | 8.50 | |||
| Marie-Claire Haki | PS | 2,262 | 5.32 | |||
| Christine Régentête | ECO | 1,257 | 2.96 | |||
| Claudette Balleydier | EXG | 475 | 1.12 | |||
| Mathieu Normand | ECO | 428 | 1.01 | |||
| Béatrice Palacios | DIV | 242 | 0.57 | |||
| Christine Amanieu | DVG | 195 | 0.46 | |||
| Votes | 42,525 | 100.00 | 35,063 | 100.00 | ||
| Valid votes | 42,525 | 97.47 | 35,063 | 90.51 | ||
| Blank votes | 796 | 1.82 | 2,792 | 7.21 | ||
| Null votes | 307 | 0.70 | 883 | 2.28 | ||
| Turnout | 43,628 | 51.69 | 38,738 | 45.90 | ||
| Abstentions | 40,775 | 48.31 | 45,650 | 54.10 | ||
| Registered voters | 84,403 | 84,388 | ||||
| Source: Ministry of the Interior[1] | ||||||
2012
| Candidate | Party | First round | Second round | ||||||||
|---|---|---|---|---|---|---|---|---|---|---|---|
| Votes | % | Votes | % | ||||||||
| Hervé Morin | NC | 18,725 | 38.40% | 25,166 | 53.17% | ||||||
| Mélanie Mammeri | PS | 12,326 | 25.28% | 22,164 | 46.83% | ||||||
| Nadiejda Steffan | FN | 7,347 | 15.07% | ||||||||
| Francis Courel | 5,535 | 11.35% | |||||||||
| Pascal Didtsch | FG | 2,334 | 4.79% | ||||||||
| Rebecca Armstrong | EELV | 1,421 | 2.91% | ||||||||
| Annie Brunner | DLR | 528 | 1.08% | ||||||||
| Sylvie Favier | NPA | 319 | 0.65% | ||||||||
| Yasmina Gharet | LO | 231 | 0.47% | ||||||||
| Valid votes | 48,766 | 98.28% | 47,330 | 96.66% | |||||||
| Spoilt and null votes | 851 | 1.72% | 1,633 | 3.34% | |||||||
| Votes cast / turnout | 49,617 | 60.73% | 48,963 | 59.93% | |||||||
| Abstentions | 32,086 | 39.27% | 32,734 | 40.07% | |||||||
| Registered voters | 81,703 | 100.00% | 81,697 | 100.00% | |||||||
References
- "Résultats des élections législatives 2017" [Results of Legislative Election] (in French). Ministry of the Interior.
- "Résultats des élections législatives 2012" [Results of Legislative Election] (in French). Ministry of the Interior.
This article is issued from Wikipedia. The text is licensed under Creative Commons - Attribution - Sharealike. Additional terms may apply for the media files.