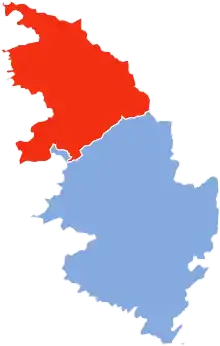
Corse-du-Sud's 1st constituency
Corse-du-Sud's 1st constituency is one of two French legislative constituencies in the department of Corse-du-Sud. It is currently represented by Jean-Jacques Ferrara of The Republicans (LR).
| Corse-du-Sud's 1st constituency | |
|---|---|
| Constituency for the National Assembly | |
 Boundary of Corse-du-Sud's 1st constituency in Corse-du-Sud | |
 Location of Corse-du-Sud within France | |
| Department | Corse-du-Sud |
| Region | Corsica |
| Population | 74,186 (2013)[1] |
| Electorate | 50,873 (2017)[2] |
| Current constituency | |
| Deputy | Jean-Jacques Ferrara |
| Political party | LR |
| Parliamentary group | LR |
Historic representation
| Legislature | Start of mandate | End of mandate | Deputy | Party | |
|---|---|---|---|---|---|
| 6th | 3 April 1978 | 22 May 1981 | Jean Bozzi | RPR | |
| 7th | 2 July 1981 | 1 April 1986 | Nicolas Alfonsi | MRG | |
| 8th | 2 April 1986 | 14 May 1988 | Proportional representation | ||
| 9th | 23 June 1988 | 1 April 1993 | José Rossi | UDF | |
| 10th | 2 April 1993 | 17 November 1994 | |||
| 18 November 1994 | 28 June 1995 | Marc Marcangeli | CCB | ||
| 29 June 1995 | 9 September 1995 | Vacant | |||
| 10 September 1995 | 21 April 1997 | José Rossi | UDF | ||
| 11th | 12 June 1997 | 18 June 2002 | |||
| 12th | 19 June 2002 | 19 June 2007 | Simon Renucci | DVG | |
| 13th | 20 June 2007 | 19 June 2012 | |||
| 14th | 20 June 2012 | 20 June 2017 | Laurent Marcangeli | UMP | |
| 15th | 21 June 2017 | ongoing | Jean-Jacques Ferrara | LR | |
Elections
2017
| Candidate | Label | First round | Second round | |||
|---|---|---|---|---|---|---|
| Votes | % | Votes | % | |||
| Jean-Jacques Ferrara | LR | 7,603 | 33.50 | 12,278 | 64.99 | |
| Maria Guidicelli | REM | 4,872 | 21.46 | 6,614 | 35.01 | |
| Jean-Paul Carrolaggi | REG (PaC) | 4,859 | 21.41 | |||
| Francis Nadizi | EXD | 2,756 | 12.14 | |||
| Jacques Casamarta | FI | 1,559 | 6.87 | |||
| Anissa-Flore Amziane | PCF | 627 | 2.76 | |||
| Corinne Bucchini | EXD | 153 | 0.67 | |||
| Estelle Jaquet | EXG | 113 | 0.50 | |||
| Jérôme Bianchi | DIV | 109 | 0.48 | |||
| Jean-Yves Santini | DIV | 47 | 0.21 | |||
| Jean-Jacques Comiti | DIV | 0.00 | ||||
| Votes | 22,698 | 100.00 | 18,892 | 100.00 | ||
| Valid votes | 22,698 | 97.71 | 18,892 | 91.10 | ||
| Blank votes | 331 | 1.42 | 1,058 | 5.10 | ||
| Null votes | 200 | 0.86 | 787 | 3.80 | ||
| Turnout | 23,229 | 45.65 | 20,737 | 40.76 | ||
| Abstentions | 27,651 | 54.35 | 30,136 | 59.24 | ||
| Registered voters | 50,880 | 50,873 | ||||
| Source: Ministry of the Interior[3] | ||||||
2012
| Candidate | Party | First round | Second round | ||||||||
|---|---|---|---|---|---|---|---|---|---|---|---|
| Votes | % | Votes | % | ||||||||
| Laurent Marcangeli | UMP | 8,282 | 30.75% | 14,066 | 50.52% | ||||||
| Simon Renucci | DVG (CSD–PS–PRG) | 7,914 | 29.39% | 13,779 | 49.48% | ||||||
| José Risticoni | FN | 2,767 | 10.27% | ||||||||
| Romain Colonna | EELV | 2,423 | 9.00% | ||||||||
| Paul-Antoine Luciani | FG | 2,040 | 7.57% | ||||||||
| Paul-Mathieu Leonetti | CL | 1,785 | 6.63% | ||||||||
| Jean-Marc Cresp | PR | 1,301 | 4.83% | ||||||||
| Yves Daien | LO | 74 | 0.27% | ||||||||
| Pierre-Noël Tucci | GE | 0.00% | |||||||||
| Valid votes | 26,932 | 98.73% | 27,845 | 96.29% | |||||||
| Spoilt and null votes | 346 | 1.27% | 1,074 | 3.71% | |||||||
| Votes cast / turnout | 27,278 | 57.00% | 28,919 | 60.43% | |||||||
| Abstentions | 20,576 | 43.00% | 18,934 | 39.57% | |||||||
| Registered voters | 47,854 | 100.00% | 47,853 | 100.00% | |||||||
References
- "Populations légales des circonscriptions législatives pour les élections de 2017". Institut national de la statistique et des études économiques. 1 December 2016. Retrieved 9 February 2018.
- "Résultats des élections législatives 2017". Ministère de l'Intérieur. 18 June 2017. Retrieved 9 February 2018.
- "Résultats des élections législatives 2017" [Results of 2017 Legislative Election] (in French). Ministry of the Interior.
- "Résultats des élections législatives 2012" [Results of 2012 Legislative Election] (in French). Ministry of the Interior.
External links
This article is issued from Wikipedia. The text is licensed under Creative Commons - Attribution - Sharealike. Additional terms may apply for the media files.