Bicycle counter
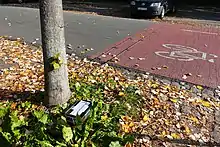
Bicycle counters are electronic devices that detect the number of bicycles at a location for a certain period of time.[1][2] Some advanced counters can also detect the speed, direction and type of bicycles.[3] These systems are sometimes referred to as bicycle barometers,[4] but the term is misleading because it indicates the measurement of pressure. Most counting stations only consist of sensors, the internal computing device, and some use a display to show the total number of cyclists of the day and the current year.[1] There are counting stations all over the world in over hundreds of cities,[5] for example in Manchester, Zagreb, or in Portland. The first bicycle counting station was installed in Odense, Denmark, in 2002.[1][4]

Persuasive Aspects
Bicycle counters are mainly being installed to assist city planning with reliable data on the development of bicycle usage.[6][7][8] Bicycle counting stations are said to raise awareness for cycling as a mode of transportation, encourage more people to use their bicycles[1][2][6][9] and give cyclists acknowledgement.[4][7] There has been no representative study on the impact of bicycle counters on citizens or by-passers, but some early empirical clues that urban visualizations can "become appropriate communication media for sharing, discussing, and co-producing socially relevant data".[10]

To increase visibility, bicycle counters are mostly installed at positions with high traffic volume and visibility to a range of road users.[2]
They have been called urban visualizations[10] and fulfill certain criteria of ambient intelligence, such as being embedded, context-aware and adaptive.[11] Bicycle counting stations can be described as persuasive technology.[12]
"Through sensing technology, a display can act as a tool that increases the capability to capture a behavior (e.g., measuring residential energy consumption, bicycle use, etc.); through its visual imagery, it can function as a medium that provides useful information, such as behavioral statistics or cause-and-effect relationships; and through its networking ability, it can become a social actor, encouraging community-based feedback and social interaction".[12]
Technical Setup
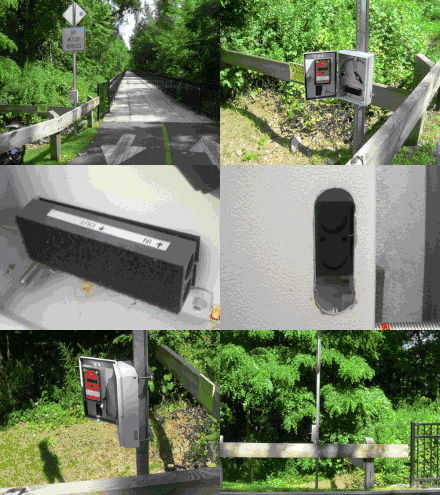
Different techniques are used for detection of bicycles, such as built in induction loops, piezoelectric strips[13], pneumatic hoses,[14] infrared sensing[5] or cameras.[2] Different setups provide different advantages such as more precise counting, battery life,[15] reduced costs or differentiation between different road users such as cyclists, pedestrians or cars.[16] Independed testing have shown that pneumatic tubes can record with over 95% accuracy[17] and piezoelectric sensors reach 99% accuracy.[15] Manufacturers state a 90% precision for induction loops.[5]

Data
Unlike manual counting or other bicycle related interventions or citizen science, where citizens manually put in data,[18] bicycle counting stations automatically generate citizen related data.[19] Automatic counting systems are said to be cheaper than manual counting by people.[8] Because of the use of communication technology in the urban context, bicycle counters can be counted as smart city technology, urban informatics or urban computing. Most of the actors who install bicycle counters, provide the number of cyclists as open data.[20]
Criticism
There has been criticism on the precision of the counting[9][21] and on the cost of bicycle counters as a waste of tax money (14000-31000€).[21][22][23]
_Tiszamenti_ker%C3%A9kp%C3%A1r%C3%BAt_(EuroVelo-11)_Kisk%C3%B6re_fel%C3%A9_2018-09-09.JPG.webp)
See also
Different cities, such as Bonn or Lahti mentioned cyclists that are a round number of counting (like number 100.000).[24][25]
Cycling barometer is also the name of a ranking by the European Cyclists' Federation for the most bicycle-friendly nations in the EU.[26]
There has been creative use of the data generated by counting stations, such as an information-design poster which includes number of daily cyclists, precipitation and temperature.[27]

| Wikimedia Commons has media related to Category:Bicycle counters. |
References
- European Commission. "Bicycle barometers (bike counters)" (PDF).
- Civitas initiative. "Measure Result - Integrating cycling with public transport in Malmo | CIVITAS". civitas.eu. Retrieved 2020-04-27.
- "Active Transport Monitoring". MetroCount. 2020-05-19. Retrieved 2020-11-25.
- Brooks, Karen (2014-09-22). "The magic of bike barometers". PeopleForBikes. Retrieved 2020-04-24.
- "Products". Eco-Counter. Retrieved 2020-04-24.
- "Fahrradbarometer". hamburg.adfc.de (in German). Retrieved 2020-04-25.
- Magni, Marie (2012-06-06). "Cycle cities awarded bicycle counters". Cycling Embassy of Denmark. Retrieved 2020-04-25.
- Wein, Martin. "Kennedybrücke in Bonn: Streit um Fahrradbarometer". GA BONN (in German). Retrieved 2020-04-25.
- Hoeft, Antonia. "Fahrradzähler bei der Wiwili-Brücke eingeweiht - Freiburg - fudder.de". fudder.de (in German). Retrieved 2020-04-25.
- Moere, Andrew Vande; Hill, Dan (2012-04-01). "Designing for the Situated and Public Visualization of Urban Data". Journal of Urban Technology. 19 (2): 25–46. doi:10.1080/10630732.2012.698065. ISSN 1063-0732. S2CID 111348602.
- Pousman, Zachary; Stasko, John (2006). "A taxonomy of ambient information systems: four patterns of design". Proceedings of the Working Conference on Advanced Visual Interfaces - AVI '06. Venezia, Italy: ACM Press: 67. doi:10.1145/1133265.1133277. ISBN 978-1-59593-353-9. S2CID 5297964.
- Claes, Sandy; Slegers, Karin; Vande Moere, Andrew (2016-05-07). "The Bicycle Barometer: Design and Evaluation of Cyclist-Specific Interaction for a Public Display". Proceedings of the 2016 CHI Conference on Human Factors in Computing Systems. San Jose California USA: ACM: 5824–5835. doi:10.1145/2858036.2858429. ISBN 978-1-4503-3362-7. S2CID 14648321.
- "RoadPod® VP". MetroCount. 2016-05-02. Retrieved 2020-11-25.
- "RidePod® BT". MetroCount. 2016-09-12. Retrieved 2020-11-25.
- "Validation of MC5720 on Albert St, East Melbourne" (PDF). Sinclaire Knight Metz.
- Greene-Roesel, Ryan; Diogenes, Mara Chagas; Ragland, David R.; Lindau, Luis Antonio (2008-04-01). "Effectiveness of a Commercially Available Automated Pedestrian Counting Device in Urban Environments: Comparison with Manual Counts". Cite journal requires
|journal=(help) - "Test d'un compteur à tubes pneumatiques du type MetroCount 5620" (PDF). Centre de recherches routières (Belgique).
- Claes, Sandy; Slegers, Karin; Vande Moere, Andrew (2016-05-07). "The Bicycle Barometer: Design and Evaluation of Cyclist-Specific Interaction for a Public Display". Proceedings of the 2016 CHI Conference on Human Factors in Computing Systems. San Jose California USA: ACM: 5824–5835. doi:10.1145/2858036.2858429. ISBN 978-1-4503-3362-7. S2CID 14648321.
- "Home - Automated pedestrian & bicycle counters". Eco-Counter. Retrieved 2020-04-24.
- EcoCounter. "Bike Count Display Interactive Map". data.eco-counter.com. Retrieved 2020-04-25.
- extra 3 (15 October 2015). "Realer Irrsinn: Fahrradzählstation in Hamburg | extra 3 | NDR". YouTube.
- Wein, Martin. "Kennedybrücke in Bonn: Streit um Fahrradbarometer". GA BONN (in German). Retrieved 2020-04-27.
- Hamburg, Hamburger Abendblatt- (2016-10-06). "Hier verschwendet Hamburg seine Steuergelder". www.abendblatt.de (in German). Retrieved 2020-04-27.
- Ottersbach, Nicolas. "Zehnmillionen Radfahrer auf Kennedybrücke: ADFC fordert in Bonn Rheinbrücke ohne Autos". GA BONN (in German). Retrieved 2020-04-25.
- Kartimo, Kristiina. "Lahti's Aleksanterinkatu street hits the threshold of 100,000 cyclists". Lahti.fi. Retrieved 2020-04-25.
- "ECF Cycling barometer | ECF". ecf.com. Retrieved 2020-04-24.
- "Bicycle Barometer - Paste in Place". www.pasteinplace.com. Retrieved 2020-04-24.