Adaptive histogram equalization
Adaptive histogram equalization (AHE) is a computer image processing technique used to improve contrast in images. It differs from ordinary histogram equalization in the respect that the adaptive method computes several histograms, each corresponding to a distinct section of the image, and uses them to redistribute the lightness values of the image. It is therefore suitable for improving the local contrast and enhancing the definitions of edges in each region of an image.
However, AHE has a tendency to overamplify noise in relatively homogeneous regions of an image. A variant of adaptive histogram equalization called contrast limited adaptive histogram equalization (CLAHE) prevents this by limiting the amplification.
Motivation and explanation of the method
Ordinary histogram equalization uses the same transformation derived from the image histogram to transform all pixels. This works well when the distribution of pixel values is similar throughout the image. However, when the image contains regions that are significantly lighter or darker than most of the image, the contrast in those regions will not be sufficiently enhanced.
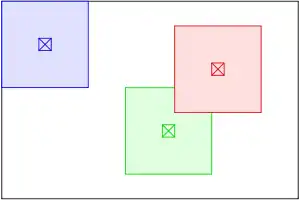
Adaptive histogram equalization (AHE) improves on this by transforming each pixel with a transformation function derived from a neighbourhood region. It was first developed for use in aircraft cockpit displays.[1] cited in [2] In its simplest form, each pixel is transformed based on the histogram of a square surrounding the pixel, as in the figure below. The derivation of the transformation functions from the histograms is exactly the same as for ordinary histogram equalization: The transformation function is proportional to the cumulative distribution function (CDF) of pixel values in the neighbourhood.

Pixels near the image boundary have to be treated specially, because their neighbourhood would not lie completely within the image. This applies for example to the pixels to the left or above the blue pixel in the figure. This can be solved by extending the image by mirroring pixel lines and columns with respect to the image boundary. Simply copying the pixel lines on the border is not appropriate, as it would lead to a highly peaked neighbourhood histogram.
Properties of AHE
- The size of the neighbourhood region is a parameter of the method. It constitutes a characteristic length scale: contrast at smaller scales is enhanced, while contrast at larger scales is reduced.
- Due to the nature of histogram equalization, the result value of a pixel under AHE is proportional to its rank among the pixels in its neighbourhood. This allows an efficient implementation on specialist hardware that can compare the center pixel with all other pixels in the neighbourhood.[3] An unnormalized result value can be computed by adding 2 for each pixel with a smaller value than the center pixel, and adding 1 for each pixel with equal value.
- When the image region containing a pixel's neighbourhood is fairly homogeneous regarding to intensities, its histogram will be strongly peaked, and the transformation function will map a narrow range of pixel values to the whole range of the result image. This causes AHE to overamplify small amounts of noise in largely homogeneous regions of the image.[4]
Contrast Limited AHE
Ordinary AHE tends to overamplify the contrast in near-constant regions of the image, since the histogram in such regions is highly concentrated. As a result, AHE may cause noise to be amplified in near-constant regions. Contrast Limited AHE (CLAHE) is a variant of adaptive histogram equalization in which the contrast amplification is limited, so as to reduce this problem of noise amplification.[3]
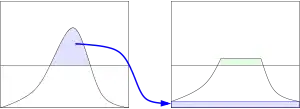
In CLAHE, the contrast amplification in the vicinity of a given pixel value is given by the slope of the transformation function. This is proportional to the slope of the neighbourhood cumulative distribution function (CDF) and therefore to the value of the histogram at that pixel value. CLAHE limits the amplification by clipping the histogram at a predefined value before computing the CDF. This limits the slope of the CDF and therefore of the transformation function. The value at which the histogram is clipped, the so-called clip limit, depends on the normalization of the histogram and thereby on the size of the neighbourhood region. Common values limit the resulting amplification to between 3 and 4.
It is advantageous not to discard the part of the histogram that exceeds the clip limit but to redistribute it equally among all histogram bins.[3]

The redistribution will push some bins over the clip limit again (region shaded green in the figure), resulting in an effective clip limit that is larger than the prescribed limit and the exact value of which depends on the image. If this is undesirable, the redistribution procedure can be repeated recursively until the excess is negligible.
Efficient computation by interpolation
Adaptive histogram equalization in its straightforward form presented above, both with and without contrast limiting, requires the computation of a different neighbourhood histogram and transformation function for each pixel in the image. This makes the method very expensive computationally.
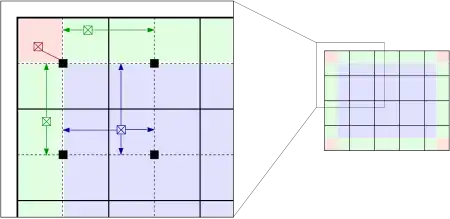
Interpolation allows a significant improvement in efficiency without compromising the quality of the result.[3] The image is partitioned into equally sized rectangular tiles as shown in the right part of the figure below. (64 tiles in 8 columns and 8 rows is a common choice.[4]) A histogram, CDF and transformation function is then computed for each of the tiles. The transformation functions are appropriate for the tile center pixels, black squares in the left part of the figure. All other pixels are transformed with up to four transformation functions of the tiles with center pixels closest to them, and are assigned interpolated values. Pixels in the bulk of the image (shaded blue) are bilinearly interpolated, pixels close to the boundary (shaded green) are linearly interpolated, and pixels near corners (shaded red) are transformed with the transformation function of the corner tile. The interpolation coefficients reflect the location of pixels between the closest tile center pixels, so that the result is continuous as the pixel approaches a tile center.

This procedure reduces the number of transformation functions to be computed dramatically and only imposes the small additional cost of linear interpolation.
Efficient computation by incremental update of histogram
An alternative to tiling the image is to "slide" the rectangle one pixel at a time, and only incrementally update the histogram for each pixel,[5] by adding the new pixel row and subtracting the row left behind. The algorithm is denoted SWAHE (Sliding Window Adaptive Histogram Equalization) by the original authors. The computational complexity of histogram calculation is then reduced from O(N²) to O(N) (with N = pixel width of the surrounding rectangle); and since there is no tiling a final interpolation step is not required.
References
- D. J. Ketcham, R. W. Lowe & J. W. Weber: Image enhancement techniques for cockpit displays. Tech. rep., Hughes Aircraft. 1974.
- R. A. Hummel: Image Enhancement by Histogram Transformation. Computer Graphics and Image Processing 6 (1977) 184195.
- S. M. Pizer, E. P. Amburn, J. D. Austin, et al.: Adaptive Histogram Equalization and Its Variations. Computer Vision, Graphics, and Image Processing 39 (1987) 355-368.
- K. Zuiderveld: Contrast Limited Adaptive Histogram Equalization. In: P. Heckbert: Graphics Gems IV, Academic Press 1994, ISBN 0-12-336155-9
- T. Sund & A. Møystad: Sliding window adaptive histogram equalization of intra-oral radiographs: effect on diagnostic quality. Dentomaxillofac Radiol. 2006 May;35(3):133-8.
External links
- A tutorial how to use CLAHE with OpenCV
- Example images demonstrating the effect of CLAHE at the Max Planck Institute of Molecular Cell Biology and Genetics
- A tutorial on CLAHE
- An example implementation of CLAHE in ANSI C by Karel Zuiderveld, one of the authors of the original CLAHE paper